
Introduction
The Rectangle Pattern is one of the most reliable and common technical signals in the financial markets. It represents a pause in a trend where price action is bounded by clear, horizontal support and resistance levels. Whether used as a signal for continuation or a potential reversal, the rectangle provides a mechanical framework for entries, exits, and profit targets. This lesson explores how to identify these "sideways" zones and how to trade the resulting breakouts with a built-in statistical edge.
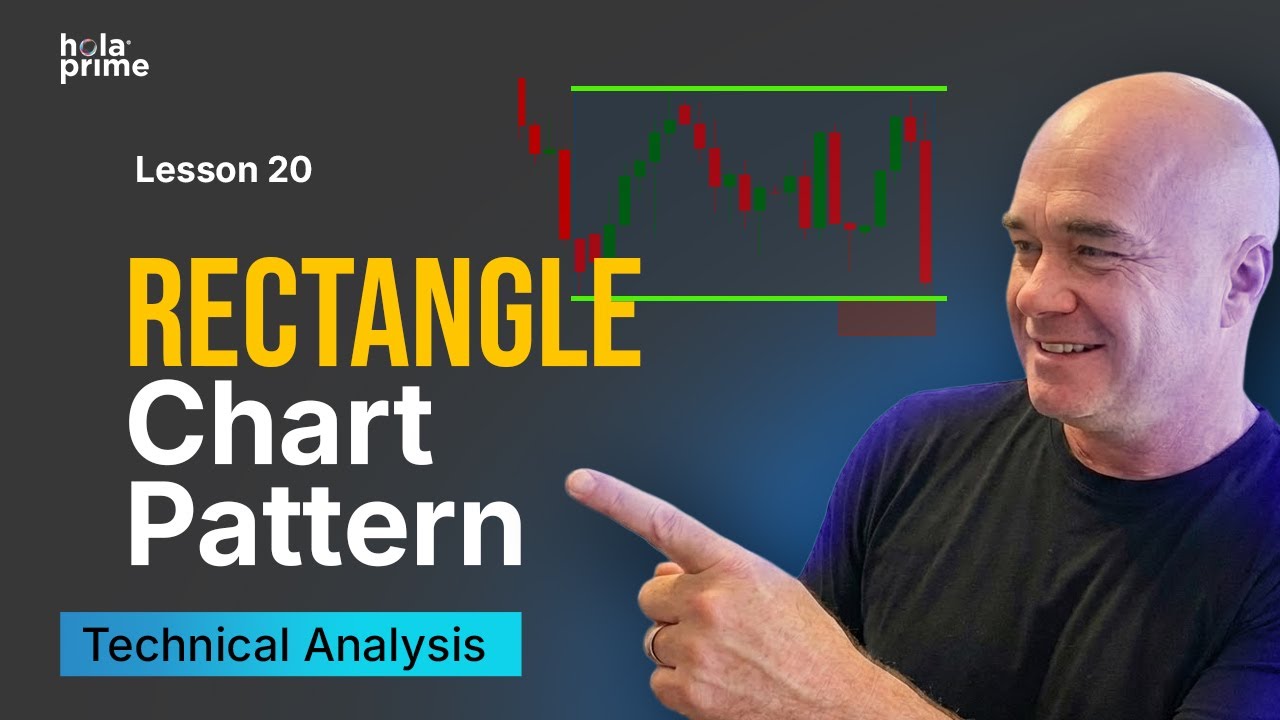
The Concept of the Rectangle Pattern
A rectangle is simply an area where buyers and sellers are in equilibrium.
-
Structure: It is formed by a solid horizontal support level and a corresponding horizontal resistance level.
-
Market Behavior: Price "bounces" back and forth between these boundaries, doing "nothingness" for a period before a catalyst eventually triggers a move.
Trading Styles: Breakouts vs. Range Trading
There are two primary ways to approach a rectangle:
-
Range Trading (Consolidation Trading): Buying at the bottom and shorting at the top. While profitable for several cycles, you will inevitably take a loss when the breakout occurs.
-
Breakout Trading: Waiting for the market to decidedly leave the rectangle. This is the preferred method for swing traders, as it follows the market's newly discovered momentum.
Why Markets Consolidate
Rectangles are not random; they typically occur for specific reasons:
-
Waiting on News: Markets often go sideways before major economic events, such as the US employment numbers (NFP).
-
Market Exhaustion: After an explosive move (e.g., Bitcoin's 30–40% gains in early 2025), traders take a "breather" to digest profits before the next trend begins.
-
Brownian Motion: Sometimes consolidation is just "noise" when there is no major institutional interest.
Higher Time Frame Reliability
The efficacy of a rectangle increases with the time frame.
-
Weekly/Daily: These rectangles are highly reliable as they represent a massive amount of trading activity and institutional consensus.
-
Shorter Time Frames: While rectangles appear on 5-minute charts (e.g., in the DAX), they are noisier and prone to rapid trend changes.
The "Measured Move" Target and 2:1 Ratio
The rectangle pattern has a built-in "measuring stick" for setting profit targets:
-
The Target: Measure the vertical height of the rectangle (e.g., 150 pips). Your target is that same distance projected from the breakout point.
-
Risk/Reward: By placing your stop-loss halfway through the rectangle and aiming for the full height as a target, you automatically establish a 2:1 reward-to-risk ratio.
-
Decisive Close: For a valid entry, wait for a solid candle close well above or below the rectangle to confirm the breakout.
Market Memory: Support Becoming Resistance
A key phenomenon to watch after a breakout is "market memory".
-
The Retest: Once price breaks out, the level that was previously support often becomes resistance (and vice versa).
-
Second Chance Entry: Traders who missed the initial breakout can often enter on the "retest" of the rectangle's boundary, using it as a springboard for the measured move.


.png)
.png)
.png)

.png)
.png)
.png)