
Introduction
In technical analysis, simple psychological levels often carry more weight than complex mathematical indicators. Large Round Figures are price points—typically ending in double zeros—that naturally attract the attention of both retail traders and institutional giants. These areas act as "magnets" for liquidity, where major firms place large orders to average their positions. This lesson explores how to identify these psychologically significant figures and how to use them to establish high-probability areas for support and resistance.
The Psychology of Large Round Figures
New traders often overlook the simplicity of round numbers, yet they are where the "real money" moves the markets.
-
Institutional Logic: Large firms often receive instructions from clients to "buy at 1.25" rather than a precise, complex figure. These massive orders naturally cluster around these easy-to-remember levels.
-
Market Magnets: Because so many traders use these levels for stop-losses, options orders, and profit-taking, price tends to gravitate toward them and react upon arrival.
Identifying Key Psychological Levels
Psychological significance is generally measured in blocks of 100.
-
Double Zeros (The Big Figures): These are the primary targets, such as 1.10, 1.20, or even 100 in dollar terms.
-
Mid-Century Marks (The 50s): Points ending in .50 (e.g., $1.50, $2.50) often serve as secondary areas of interest.
-
Scale of Interest: On a daily chart, you might look at 500-point increments for major trends, whereas a 1-hour chart trader might use every 100 points as a guideline.
Grid Trading: Setting Up Your Workspace
One of the most straightforward ways to analyze a market is by building a "grid" of round numbers.
-
Visualizing the Range: By laying out horizontal lines at every 100 or 500 points, you can clearly see how a market has been range-bound between specific "ceilings" and "floors".
-
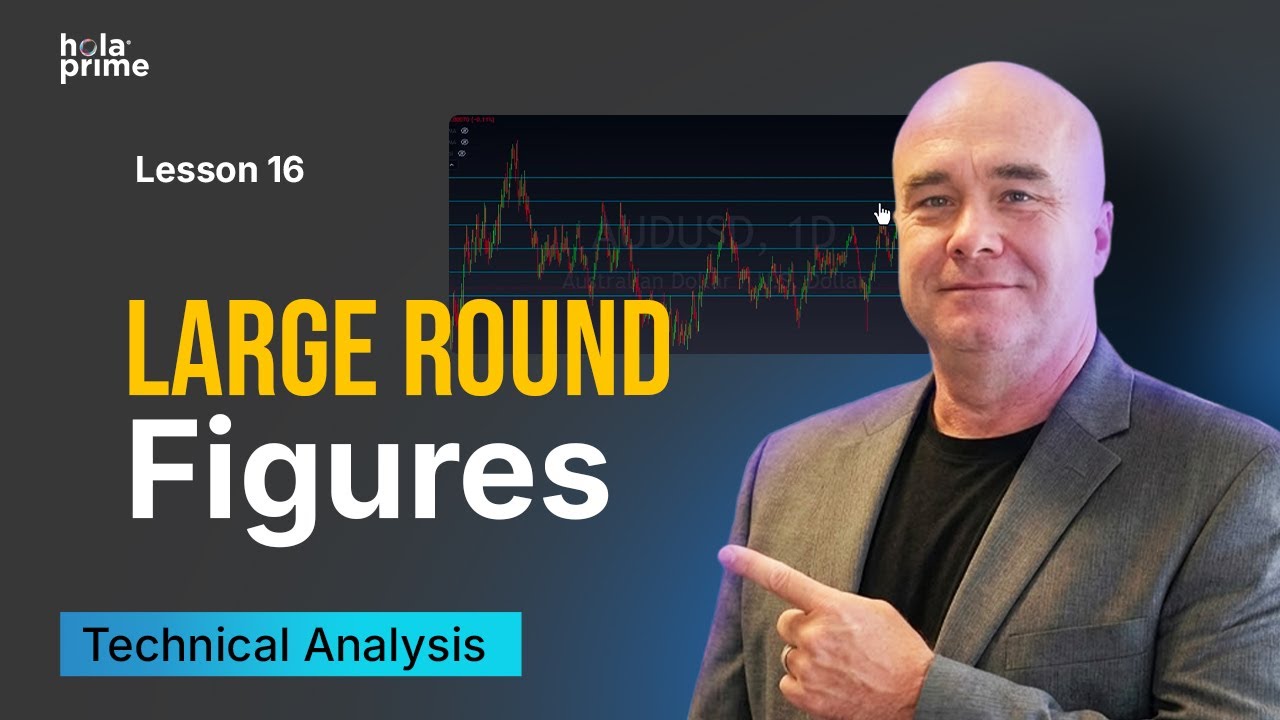
The Aussie Dollar Example: In the AUD/USD pair, price action time and again reacts at the 0.65, 0.66, 0.67, and 0.70 levels, showing that these numbers consistently influence market behavior.
Practical Applications: Forex, Indices, and Metals
Different markets require different grid scales:
-
Forex: Typically focused on 100-pip increments.
-
Indices (NASDAQ 100): Due to higher volatility, significant levels are often 1,000 points apart (e.g., 20,000, 21,000), with 500-point marks serving as intermediate support or resistance.
-
Metals (Silver): The $30 level and mid-century marks like $32.50 or $26.50 have shown clear historical importance.
Marrying Levels with Technical Triggers
A round figure alone is not a reason to take a trade; it is an area where you start looking for a trade.
-
Wait for the Reaction: You want to see the market react to the level with a specific candlestick pattern, such as a Hammer or an impulsive engulfing candle.
-
The Signal: For example, a hammer forming right above the $30 level in silver during a strong uptrend is a high-probability signal that the round-number support is holding.
-
The Target: When selling from a round-number resistance, your primary target should be the very next round-number support level in the grid.

.png)
.png)
.png)

.png)
.png)
.png)