
Introduction
Successful trading requires understanding the "why" behind market movements, not just reading candlesticks. While technical analysis provides the "where" for a trade, fundamental reasons provide the "direction". This lesson explores the powerful relationship between US interest rates, the US Dollar, and the metals markets (Gold and Silver), providing a visual framework for predicting potential trend shifts.
Fundamentals vs. Technical Analysis
The market moves on more than just price patterns; large firms invest millions into research to understand the underlying drivers.
-
The Hybrid Approach: Look for a fundamental reason for a move (e.g., a geopolitical event or interest rate change) and then find a technical setup that aligns with it.
-
Alignment: If both the fundamental reasoning and the technical setup point in the same direction, the probability of a successful trade increases.
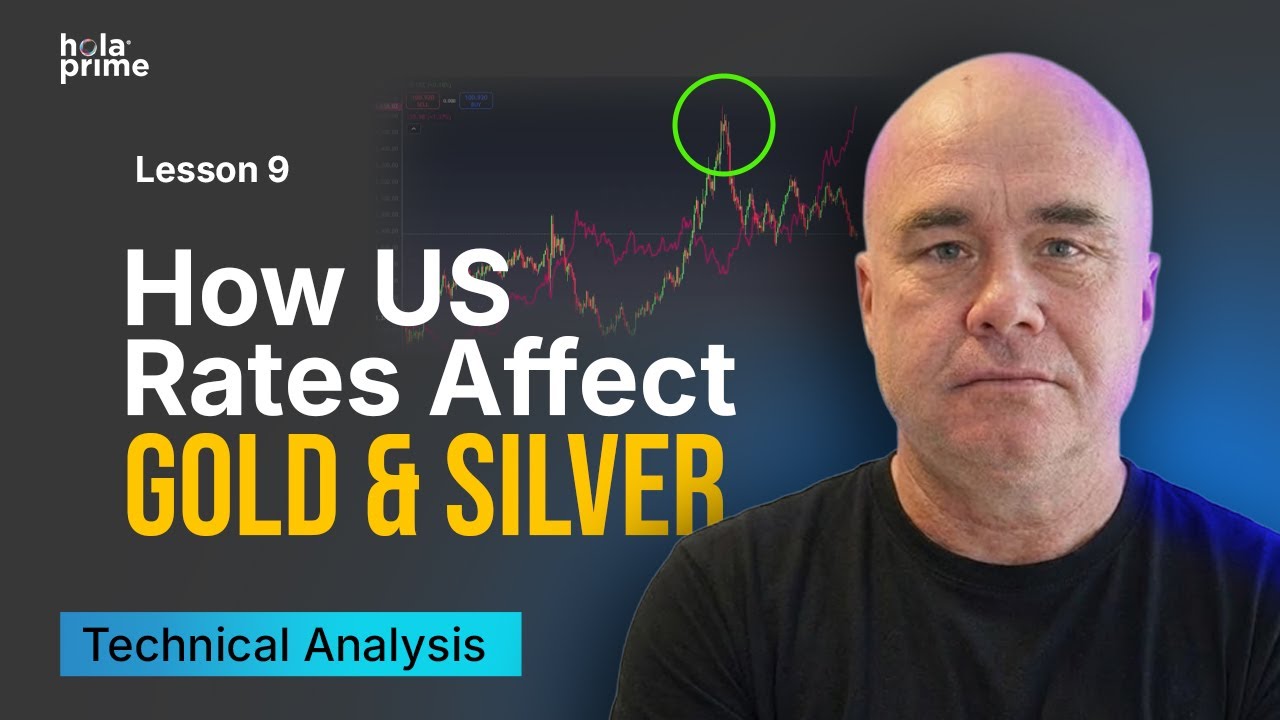
The 10-Year Treasury Yield and the US Dollar
A primary driver for the US Dollar is the 10-year Treasury Yield (symbol: US10Y).
-
Positive Correlation: Generally, when the 10-year yield rises, the US Dollar Index (DXY) also rises.
-
The Reason: Investors can make more money by holding US bonds when interest rates are higher, creating a natural demand for the Dollar.
-
Visual Guide: Although not "tick-for-tick," monitoring US10Y gives a strong directional heads-up for the broad US Dollar.
The Negative Correlation: Yields vs. Metals
Gold and Silver typically share a negative correlation with US yields and the Dollar.
-
Cost of Carry: Holding physical gold pays no interest and incurs storage fees.
-
The Trade-off: When yields rise, large funds prefer holding US Treasuries (which pay interest) over gold. When yields fall, gold becomes more attractive, often going "parabolic".
-
Historical Example: Between August and October 2022, rising 10-year yields were accompanied by falling gold prices.
Gold vs. Silver: Key Differences
A common mistake is assuming gold and silver move identically.
-
Industrial vs. Monetary: Silver often has more industrial utility and can be much noisier than gold.
-
Volatility: Silver tends to experience more extreme swings. For example, while yields were rising, silver tanked to roughly $18.25 before skyrocketing once yields eventually dropped.
Exceptions: Trading During Market Panic
There are rare times when both the US Dollar and Gold rise simultaneously.
-
Safety Bid: During periods of extreme geopolitical risk or panic (e.g., September 11, 2001), investors rush to both the US Dollar and Gold for safety.
-
Fear Factor: In these scenarios, the standard negative correlation breaks down as "nobody knows what is going to happen," driving a universal flight to safety.
Using Inter-market Analysis as a Guide
You can use the levels of one asset to make decisions on another.
-
Support and Resistance: If the US Dollar Index (DXY) is sitting at a major technical support level (like the 100 level), a bounce in the Dollar could signal a pullback in Gold.
-
Profit Taking: If you own Gold and see the Dollar approaching strong support, it may be a technical sign to take profits.

.png)
.png)
.png)

.png)
.png)
.png)