
Introduction
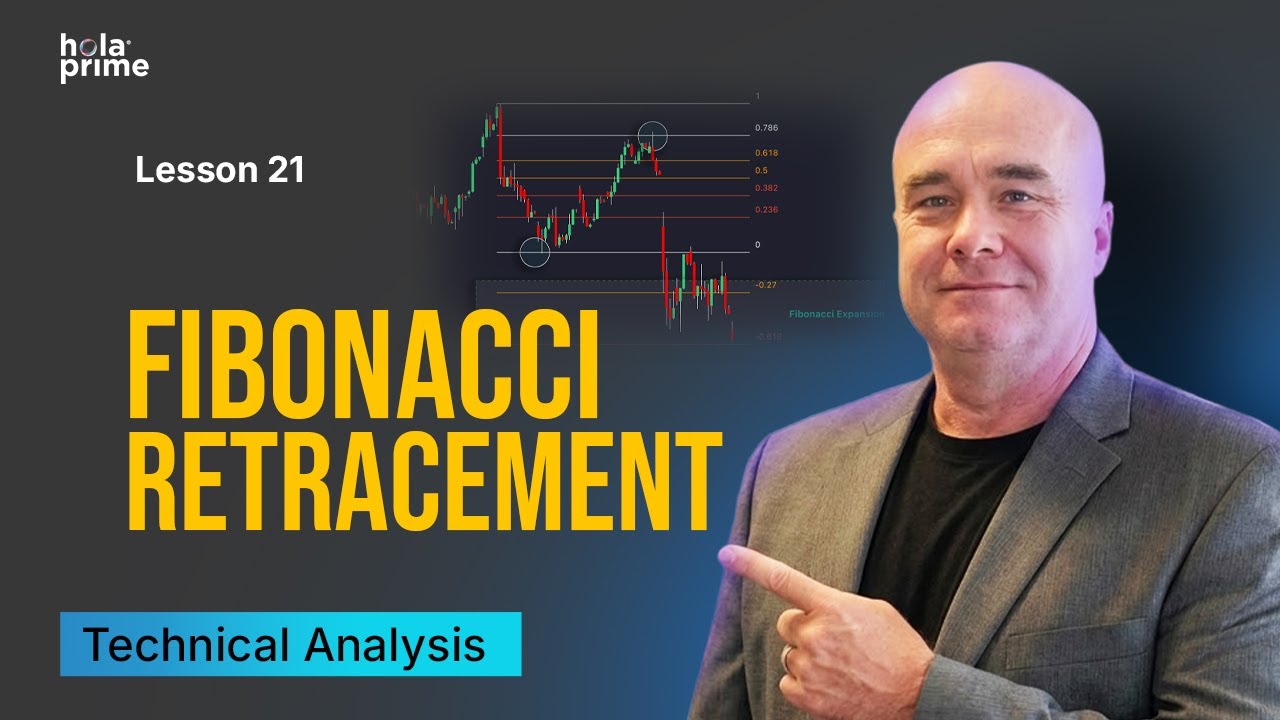
Fibonacci is a mathematical theorem discovered in the 1200s that describes repeating patterns and ratios found throughout nature. In the financial markets, the Fibonacci Retracement tool is used to predict where a price might "pull back" before continuing its original trend. While powerful, Fibonacci is most effective when used as one part of a broader strategy, identifying areas of "confluence" where multiple groups of traders are likely to enter the market.
The Origins and Nature of Fibonacci
The sequence (1, 1, 2, 3, 5, 8...) describes ratios that repeat in everything from crop growth to the way mountains rise and fall.
-
The Golden Ratio: 61.8% is the most famous Fibonacci ratio, often considered the "golden mean" of mathematics and aesthetic beauty.
-
Market Correlation: Over time, traders noticed that markets often respect these same natural ratios during price corrections.
Key Fibonacci Retracement Levels
Most traders focus on three primary levels when looking for a price bounce:
-
38.2%: A shallow retracement often seen in very strong trends.
-
50%: Not technically a Fibonacci ratio, but an old "Wall Street" rule of thumb that many traders include in their toolsets.
-
61.8%: The "Golden Mean" and often considered the most significant technical level.
-
Others: Levels like 23.6%, 78.6%, and 161.8% are used by some specialists, but are less widely followed than the primary three.
The "One-Two-Three" Combination for Entry
Fibonacci alone is subjective and not a guaranteed reversal point. To increase reliability, look for a three-step confirmation:
-
The Level: Price reaches a significant Fibonacci level (e.g., 50% or 61.8%).
-
Market Memory: The level aligns with a previous area of resistance that should now act as support.
-
Price Action: A clear candlestick signal, such as a Hammer or Shooting Star, forms at the level.
Fibonacci as a Confluence Tool
The true power of Fibonacci lies in bringing different types of traders together:
-
Groups of Traders: By entering at a Fibonacci level that also aligns with a moving average (like the 50-day EMA) and a large round number, you are trading alongside three separate groups of market participants.
-
Increased Probability: This "confluence of events" significantly increases the likelihood that the support or resistance will hold.
Practical Examples
-
Bitcoin: After a massive move, Bitcoin dropped exactly to the 50% retracement level, formed a large hammer, and broke above its 200-day EMA, signaling a clear entry point.
-
FTSE 100: Traders might wait for a pullback to the 38.2% level, which aligns with a previous swing high at 8,500 and the 50-day EMA, creating a strong area of "market memory" support.
-
CHF/JPY: The pair bounced off the 38.2% level and formed a shooting star, providing a technical signal to join the downtrend.
Advanced Use Cases
Beyond entries, Fibonacci can help manage an active trade:
-
Moving Stop-Losses: As price breaks through levels like the 23.6% retracement, you can move your stop-loss behind that level to lock in profits while aiming for the previous high/low.
-
Targets: Traders frequently use previous Fibonacci extremes (0% or 100%) as logical targets for their moves.

.png)
.png)
.png)

.png)
.png)
.png)