


Why Moving Average is Considered a Key Concept in Prop Trading
- Ankit Gupta
- March 5, 2025

In prop trading, spotting trends quickly can make a big difference in how much you earn. Moving Averages (MAs) are helpful tools that show the average price over time, making it easier to see the overall direction of the market. They smooth out short-term price changes so traders can focus on the bigger picture. Learning how different types of MAs—like Exponential or Weighted—work can help traders fine-tune their approach and make better choices in all kinds of market conditions.
There are different categories of the Moving Average (MA)
1 – Exponential Moving Average (EMA)
2 – Weighted Moving Average (WMA)
3 – Double Exponential Moving Average (DEMA)
4 – Triple Exponential Moving Average (TEMA)
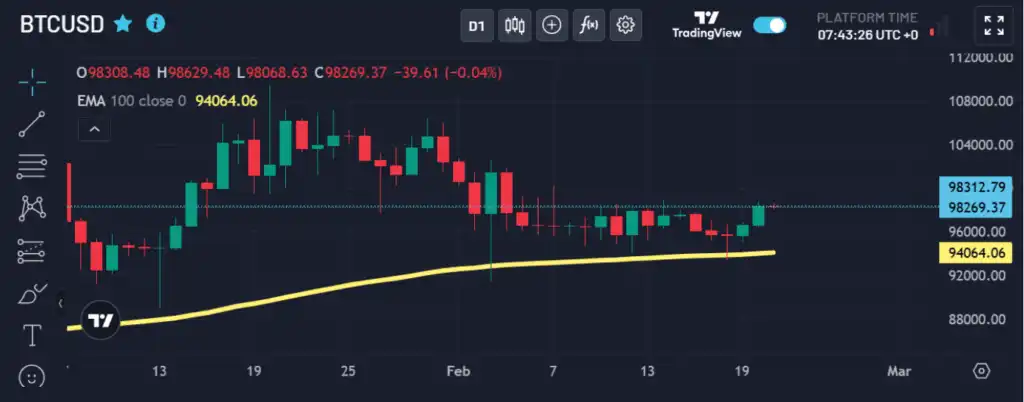
Exponential Moving Average
This is an average that helps track the price movement over a period of time, providing more weightage to recent price levels and less to older prices. This kind of price outcome will help to understand the trend of the trade. This will enable traders to understand the bear or bull market for the prices. Below are the examples of EMA for BTCUSD representing a bearish trend.
Calculation Methodology
EMA = (Closing Price x multiplier) + [EMA (from the previous day) x (1 – multiplier)]
Multiplier = 2 ÷ (N + 1), where N is the number of days in the EMA
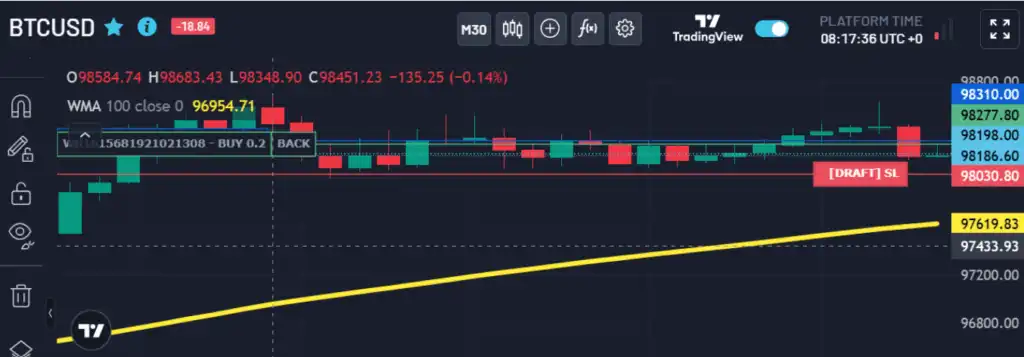
Weighted Moving Average
This kind of average calculation is worked out by assigning greater weight to the latest data points of volume and prices. The calculation is done by multiplying each price by a predetermined weight and summing up the final outcome. The traders use this average to enter and exit a trade. The market momentum can be gauged as well. Generally, the traders use EMA and WMA to arrive at a conclusion for their trading.
Technological Developments
With the advancement of technology, the usage of silver for future development and new-edge applications will come into play. Keeping in mind the ever-increasing demand inthe future the prices will also vary.
Double Exponential Moving Average
This calculation is based on increasing the level of price sensitivity of the moving average and curbing the price lag. This helps in identifying any sudden price movements and alerts traders. The decisions can be far more accurate for a trader since the market momentum can be captured and help reduce losses. DEMA needs to be carefully used as the prices are at times impacted by rumors or knee-jerk reactions. So as a prop trader, it is essential to not just look at this metric, but instead study it on an overall basis including market sentiments.
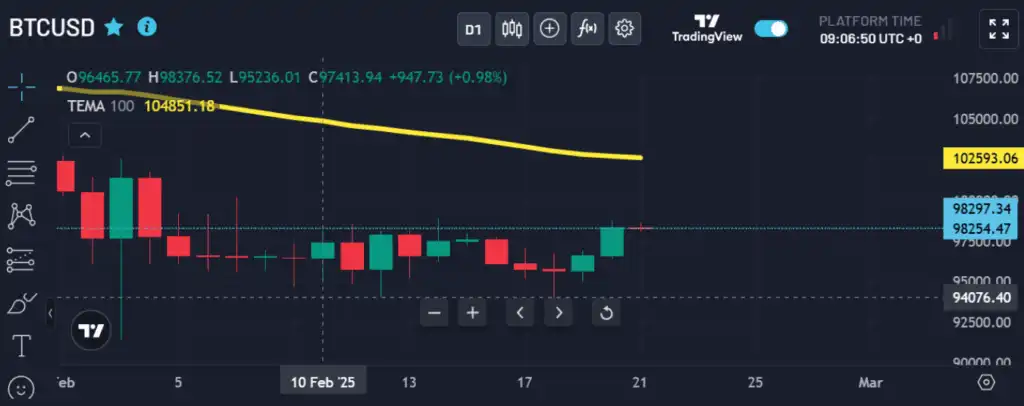
Triple Exponential Moving Average
This is a calculation methodology that combines all three single, double, and triple exponential moving averages. The objective of the calculation is to provide details by adjusting for volatility and being more price-sensitive. Long-term traders tend to use this tend to use this average as the price as the price sensitivity can be observed and a clear view of fundamentals can be gained. This is best used in an extremely volatile market, or during key events and news, to understand the price impact in a short period.
Calculation Methodology
TEMA = 3EMA – 3EMA(EMA) + EMA(EMA(EMA))
Conclusions
As the best Prop Trading Firm, we suggest not be to be dependent on using just the above-mentioned strategies. One needs to consider the below-mentioned details and then arrive at a conclusion.
1 – Understanding the key events that pertain to geo-political and economic activities and linking them to the average outcomes.
2 – Taking into account market sentiments and their impact on prices in both the short-term and long-term.
3 – Business Cycles – It is extremely important to understand the business cycles of the trading instruments and then calibrate them to the price and its average levels.
4 – Back-testing the data with available details of different moving averages will understand the entry and exit of trades better.
5 – Selecting the appropriate “Period” for averages will help you make better decisions.
6 – Seeking expert guidance if needed – Please utilize the Hola Prime Academy coaches and freely available material so that such complex calculations can be understood.
Feel free to share your thoughts and suggestions at contactus@holaprime.com.
Disclaimer: All information provided on this site is for educational purposes only, related to trading in financial markets. It is not intended as financial advice, business or investment recommendation, or as an opportunity or recommendation to trade any investment instruments. Hola Prime only provides an educational environment to traders, including tools, materials and simulated trading platforms which have data feed provided by Liquidity Providers. The information on this site is not directed at residents in any country or jurisdiction where such distribution or use would be contrary to local laws or regulations.