はじめに
If you have spent enough time watching charts, you have probably noticed this already.
まだご質問がありますか?
ぜひ、今すぐお気軽にお問い合わせください!

免責事項
本サイトに掲載されているすべての情報は、金融市場における取引に関する教育目的のみを意図したものです。これらは、金融アドバイス、事業または投資の推奨、あるいはいかなる投資商品の取引機会や推奨を意図するものではありません。Hola Primeは、流動性プロバイダーから提供されるデータフィードを備えたツール、資料、および模擬取引プラットフォームを含め、トレーダーに対して教育環境を提供するのみです。 本サイトの情報は、その配布または利用が現地の法律や規制に違反する国または管轄区域の居住者を対象としたものではありません。
If you have spent enough time watching charts, you have probably noticed this already.
Some weeks feel easy. Price moves in one direction, setups make sense, and trades follow through. Then suddenly, the same strategy stops working. Price chops around, stops get hit, and nothing seems to move the way it should.
That shift is not random.
It is the market changing how it behaves.
Most traders do not lose because they lack strategies. They lose because they keep using the same approach even when the market has clearly changed its tone. A setup that works well in a clean trend can fall apart the moment price starts moving sideways.
The market did not break. The environment changed.
This is where market regimes matter. Once you understand whether the market is trending, ranging, or moving through a transitional phase, a lot of confusion disappears. You stop forcing trades, stop blaming your system, and start matching your decisions to what price is actually doing.
A market regime describes how price is behaving during a specific period, such as trending, ranging, or transitioning between the two.
Think of it less like a fixed rule and more like a market condition.
Is price moving with clear direction?
Is it stuck between support and resistance?
Is it messy, unstable, and shifting from one phase to another?
Markets constantly cycle through these conditions. None of them is rare. Trends, ranges, and transitions are natural parts of price behaviour.
One important thing many traders miss is that regimes depend on timeframe. A chart can look messy on a five-minute view but clean and directional on a four-hour chart. That is why regime awareness only works when it is tied to your execution timeframe.
Ignoring this often leads to overtrading, frustration, and poor strategy selection.
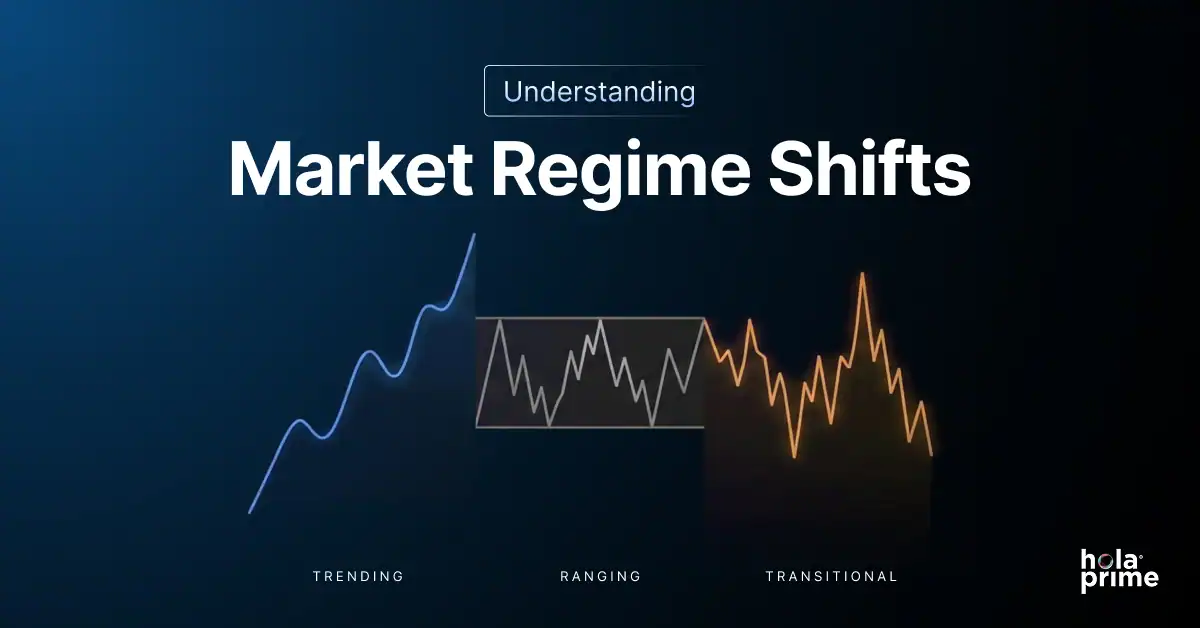
A trending market has clear direction, a ranging market moves sideways between levels, and a transitional market sits between the two while price behaviour becomes less stable.
|
Trending Market |
Ranging Market |
Transitional Market |
|
How to identify: Higher highs and higher lows in an uptrend, or lower highs and lower lows in a downtrend. Pullbacks are controlled and price follows through. Best strategy type: Pullbacks, trend continuation, breakout continuation, momentum alignment. Risk sizing: Normal risk may be used when structure is clear, but avoid chasing extended moves. |
How to identify: Price moves between support and resistance without sustained direction. Breakouts often fail and price returns toward the middle. Best strategy type: Mean reversion, range extremes, quick profit-taking, support and resistance reactions. Risk sizing: Smaller or tighter risk because follow-through is limited and false breakouts are common. |
How to identify: Old trend structure weakens, breakouts fail, pullbacks deepen, volatility rises without clean follow-through. Best strategy type: Smaller trades, reduced frequency, waiting for clarity, or stepping aside. Risk sizing: Smallest risk, or no trade, because price behaviour is unstable and signals are mixed. |
This table is the core idea of market regime trading: do not use the same approach in every environment.
A trend rewards patience and continuation.
A range rewards selectivity and mean reversion.
A transition rewards caution.
A trending market is usually the easiest to spot after the fact, but not always easy to trade in real time.
In this phase, price consistently pushes higher or lower. In an uptrend, price forms higher highs and higher lows. In a downtrend, price forms lower highs and lower lows.
Trends often begin quietly. A level breaks, pullbacks stay shallow, and price keeps moving in the same direction. As confidence builds, more traders join in. That is when trends start to feel obvious, even though the best entries often came earlier.
Strong trends usually appear when one side of the market gains a real advantage.
This can come from changes in interest rates, macro data, policy decisions, or a shift in overall sentiment. In futures and forex markets, these moves often tie back to central bank actions or long-term economic expectations.
As price starts moving, breakout traders join in. Pullback traders follow. Stops from the losing side get triggered. All of this adds fuel to the same move, which is why trends can last longer than many traders expect.
In a healthy trend, pullbacks tend to be controlled rather than chaotic.
Price often respects previous structure or commonly watched levels. Volatility expands when price pushes in the trend direction and cools off during retracements.
One thing that stands out in strong trends is how often reversal attempts fail. Traders keep trying to pick tops or bottoms, only to get stopped out repeatedly.
Trends reward patience. Traders who wait for pullbacks usually do better than traders who chase price after large moves.
One of the biggest mistakes traders make in trends is overcomplicating entries.
They look for perfect reversals instead of accepting continuation setups. Another mistake is taking profits too early because the move already feels big.
In strong trends, price can stay extended longer than expected.
Fighting the trend with counter-trend trades may work occasionally, but it often leads to a series of small wins followed by one large loss.
Ranging markets occur when price moves sideways between clear support and resistance levels.
There is no sustained directional control. Buyers and sellers are both active, but neither side has enough strength to create a lasting move.
In a range, traders should stop thinking like trend followers and start thinking in terms of boundaries.
Where is support?
Where is resistance?
Where is the middle of the range?
Is price near an extreme or stuck in the middle?
Those questions matter more in a range than chasing direction.
Ranges form when there is balance.
Neither side has enough conviction to push price into a sustained move. This often happens during periods of uncertainty, ahead of major economic events, or after a strong trend where participants pause to reassess value.
Institutions may also be accumulating or distributing positions quietly during ranges, which is why breakouts from ranges can be sharp once the balance finally breaks.
In a range, price repeatedly returns to the middle.
Breakouts often fail. Indicators that work well in trends tend to give false signals. Volatility is usually lower, and candles overlap more frequently.
Support and resistance become more important than trendlines.
Mean reversion strategies often perform better, where traders fade moves into extremes instead of chasing momentum.
The most common mistake is trying to force trends where none exist.
Traders buy breakouts only to watch price snap back into the range. Others overtrade the middle of the range, where risk-reward is poor.
Another issue is impatience. Ranging markets test discipline because they offer fewer clean setups.
Many traders lose money simply because they feel the need to trade every small move.
Transitional markets sit between trends and ranges.
This is where many traders struggle, not because the market is impossible to read, but because expectations are misaligned with reality.
A trader may still expect clean trend continuation while the market is already weakening. Another trader may treat the market like a range, just before it breaks into a new trend.
In transitional phases, old rules stop working before new rules become clear.
A transitional phase occurs when a market is shifting from a trend into a range, from a range into a trend, or changing trend direction entirely.
During this phase, price behaviour becomes messy.
偽のブレイクアウトや反転の失敗、急激なボラティリティの上昇はよくあることです。市場は、本質的に次にどう動くべきかを決めようとしているのです。
This is why transitional phases are dangerous. They tempt traders into certainty when the market has not given clarity yet.
You may notice that trends stop making clean higher highs or lower lows.
Pullbacks become deeper. Volatility increases without follow-through. Key levels break and then immediately reclaim.
相場が転換期にある際、指標同士が相反することがよくあります。トレンド指標は遅行する一方、オシレーターは買われすぎと売られすぎの間を急速に行き来します。
Common signs include:
Trend structure starts weakening.
Breakouts fail quickly.
Pullbacks become deeper than usual.
Price keeps reclaiming broken levels.
Volatility rises without clean direction.
Signals conflict across indicators.
Lower timeframes become noisy and difficult to read.
Transitional markets punish certainty.
Traders who are too confident in one direction tend to get chopped. Systems that rely on clean structure suffer because the structure is being redefined.
This phase often produces emotional trading. Losses feel random, which pushes traders to revenge trade or abandon risk rules.
In reality, the market is simply changing regimes.
The correct response is not to force more trades. The correct response is to reduce risk, wait for clarity, or step aside.
The goal is not to predict regime changes perfectly.
The goal is to recognize them early enough to adjust behaviour.
In trends, focus on continuation setups, pullbacks, and momentum alignment.
In ranges, prioritize fading extremes and taking profits faster.
In transitional phases, trade smaller or wait until the market becomes clearer.
Many strong traders reduce size or stop trading entirely during transitions. Sitting out is also a position.
Different regimes reward different strategies.
A trend-following strategy needs directional follow-through. A range strategy needs reliable boundaries. A transitional market often offers neither.
That is why one strategy cannot perform equally well in every condition.
A trader should match strategy to regime:
Trending market: continuation setups.
Ranging market: support and resistance reactions.
Transitional market: smaller trades, fewer trades, or no trade.
The market does not owe your strategy the right conditions. Your job is to know when your strategy fits the current environment.
Risk should expand and contract with clarity.
Trending markets may allow for normal risk because the structure is clearer. Ranging markets often require tighter stops and quicker exits because follow-through is limited. Transitional phases demand the smallest risk because the environment is unstable.
Drawdowns often happen when traders keep the same position size across every market regime.
They trade a messy transition with the same confidence they used in a clean trend.
That is usually where losses accelerate.
Multiple timeframe analysis helps identify market regimes more clearly.
A market may appear choppy on a lower timeframe but clearly trending on a higher one. The opposite can also happen: a lower timeframe may show a clean move inside a larger range.
This is why regime awareness must match your trading timeframe.
If you execute on the 15-minute chart, do not ignore what the one-hour or four-hour chart is showing.
転換期には、短期的な変動によるノイズが増加します。視野を広げることで、物事を客観的に見られるようになることがよくあります。
Many traders become emotionally attached to a single strategy.
When it stops working, they blame execution instead of context. Others trade based on indicators without understanding what price is actually doing.
Another issue is overconfidence after strong trending periods. Success in one regime creates the false belief that the trader has mastered the market.
Then conditions change, and the same behaviour stops working.
市場は変化し続ける。その中で生き残れるのは、市場と共に進化し続けるトレーダーだけだ。
Market regime awareness is not about being clever or predictive.
It is about being honest with what price is showing you right now.
Trends, ranges, and transitions are natural phases of market behaviour. None of them is good or bad on its own. They simply require different responses.
トレーダーが無理に取引をしようとするのをやめ、相場環境に適応し始めると、自然と成績の安定性が向上します。損失の理由もより明確になり、ドローダウンは縮小します。そして、自信は感情的なものではなく、より落ち着いたものになります。
The market is always speaking.
Understanding its regime is how you learn to listen.
著者について:サム・サレ
ロンドンを拠点とするトレーダーのサム・サレは、ベッドフォードシャー大学で経営学を学んでいた19歳の時にトレーディングの道を歩み始めました。トレーディングの専門知識とマーケティングのバックグラウンドを活かし、現在はHola Primeでコーチを務め、トレーダーの自信、一貫性、そして金融リテラシーを養うことを目的とした教育コンテンツの開発に取り組んでいます。