The Elliott Wave Theory: The Easiest System to Trade
- Ian Coleman
- June 6, 2025
If you are serious about trading and you are not using the Elliott Wave Theory, you are missing one of the most reliable frameworks in technical analysis. It is simple. It is powerful. And when combined with a disciplined trade plan, it becomes the backbone of a high-probability trading strategy.
Let us break it down.
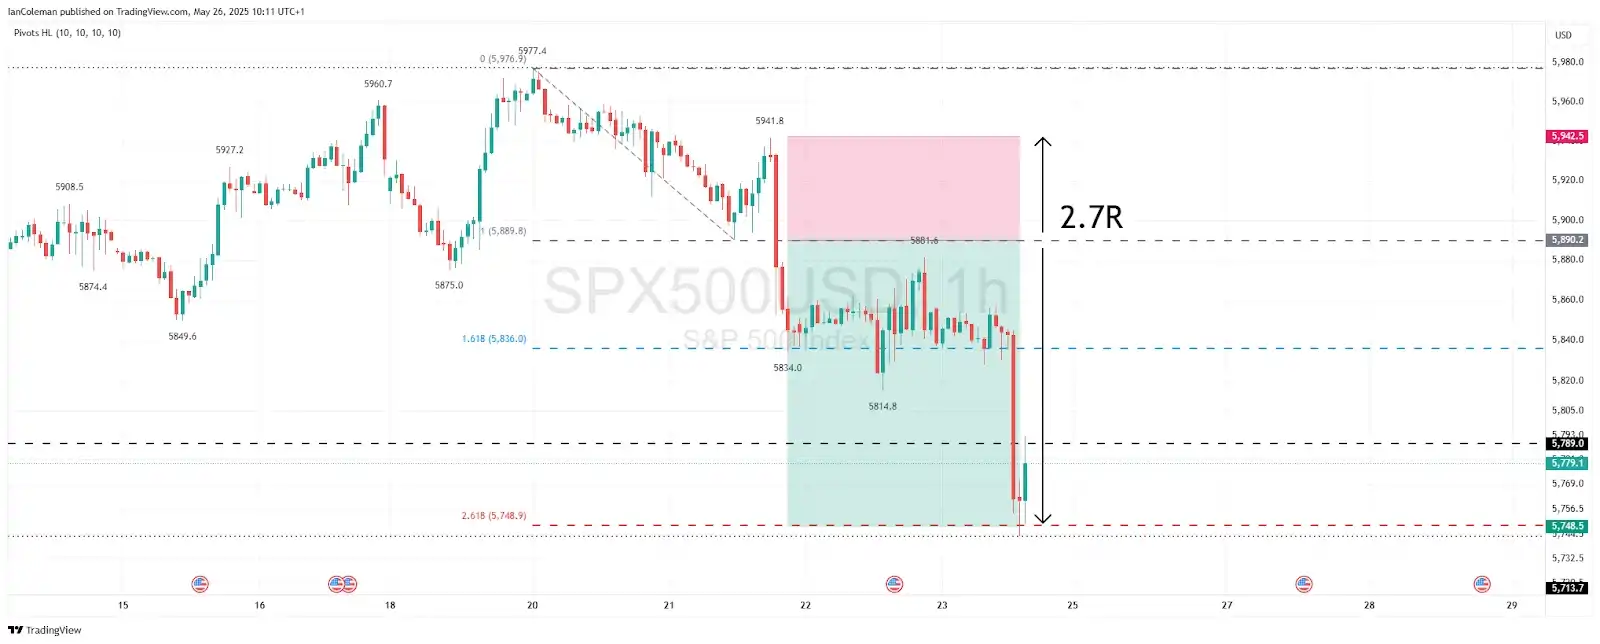
1. The Trade Plan – A Simple Calculation of Risk vs. Reward
Having a view on an asset is great, but trading blindly without a defined plan is not! We must ‘plan the trade’ and ‘trade the plan’. We need an entry, stop loss and target for this to be achieved. This will then enable us to know our risk against reward ratio.
. What Is Risk vs. Reward?
Also known as the R multiple, this is the ratio of what you stand to gain versus what you are risking.
- If you are risking $100 and your potential profit is $300, that is a 3R trade.
- Lose? You drop $100.
- Win? You bag $300.
Consistency in your R multiples is the foundation of long-term profitability.
2. Elliott Wave Theory: A Framework for Smart Entries and Exits
The Elliott Wave principle is deceptively simple. It says that markets move in predictable wave patterns driven by human behaviour.
. The Basics
- 5 impulsive waves in the direction of the trend (either up or down).
- Followed by 3 corrective waves (typically labelled A-B-C or AB-CD).
Waves 1, 3, and 5 push the market in one direction; waves 2 and 4 pull back.
. Fibonacci Extensions
Here is where it gets strategic. Most fifth waves extend to 261.8% of Wave 1 using Fibonacci projection tools. This becomes your target zone.
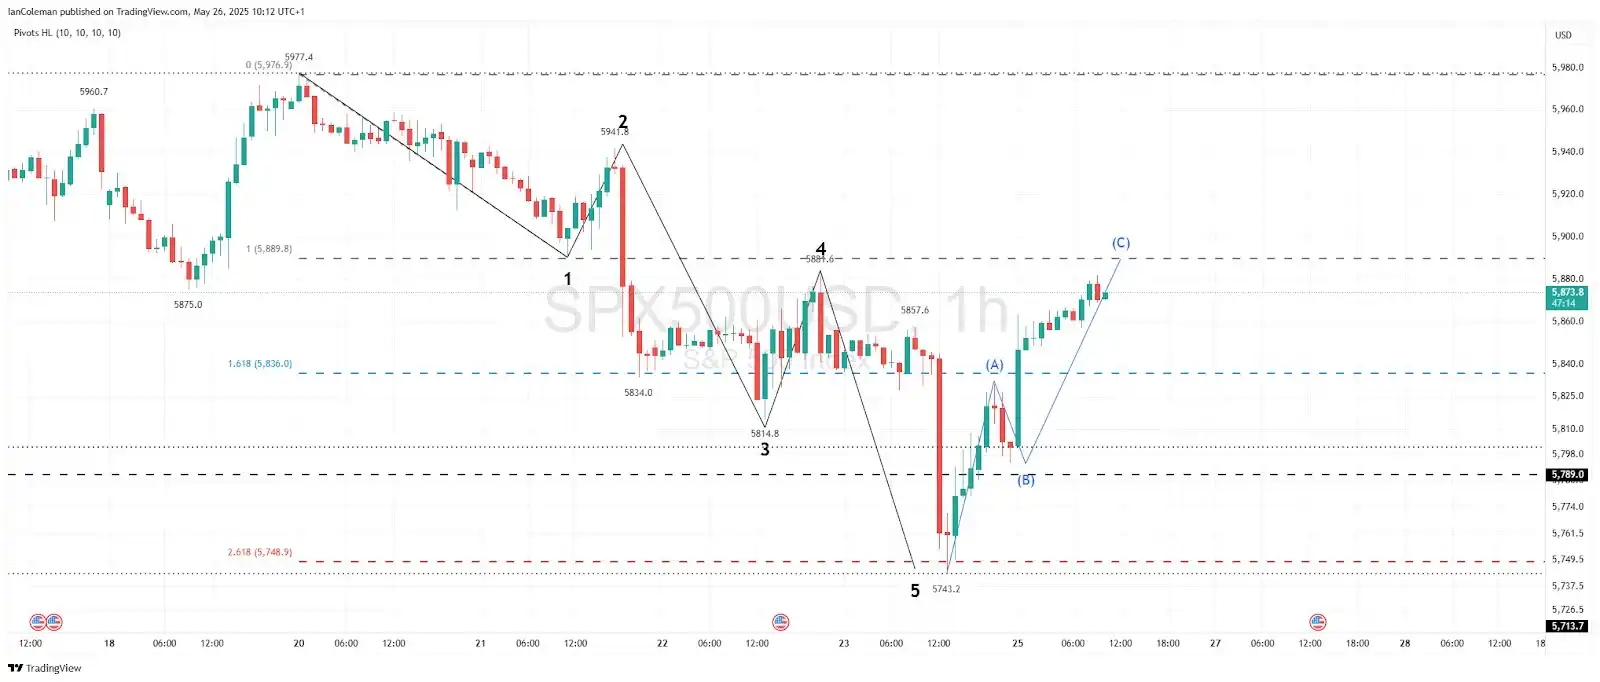
3. Trade from Wave 2 to 5 – The Sweet Spot
This is where the money is.
Catching a setup just after the Wave 2 correction—you have:
- A clear entry (end of wave 2, beginning of wave 3).
- A defined stop loss (just below wave 2’s low).
- A target (261.8% extension of wave 1).
That is a structured trade. You are not gambling—you are operating with precision.
Why does this matter? Because you only need a few winning 3R or 4R trades to beat the market consistently, even with a 40–50% win rate.
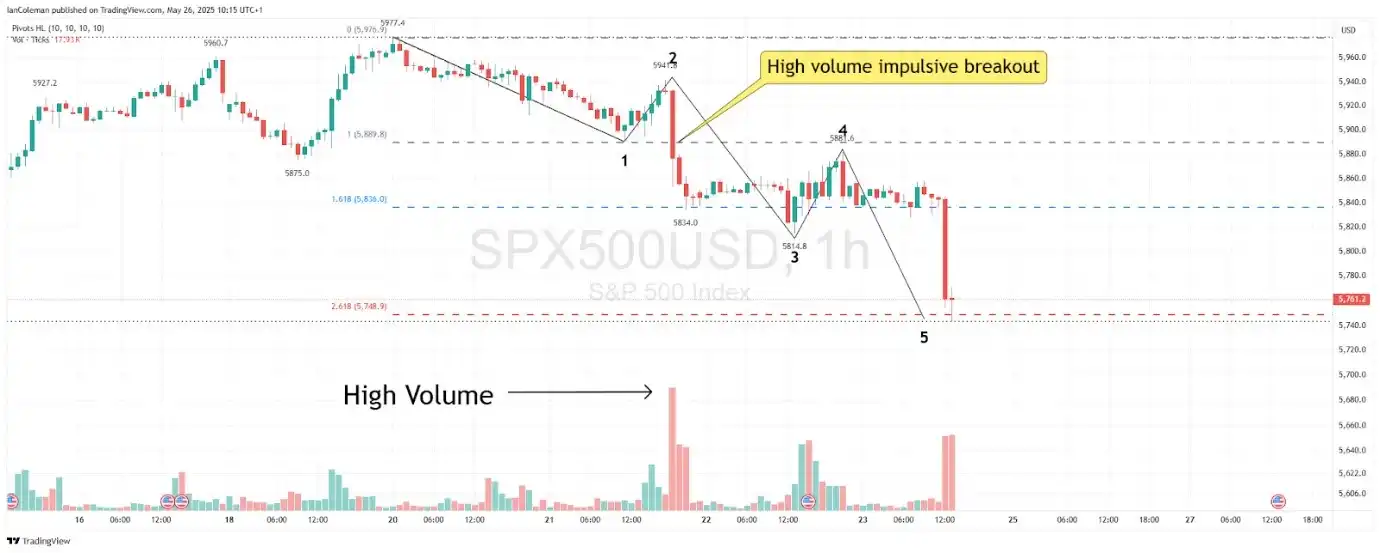
4. Spotting the Trend: Price Action and Volume
The move that breaks above or below Wave 1 is critical. It should be impulsive—no wimpy candles here.
This is often where smart money jumps in. Look for:
- Increased volume in stocks.
- Increased tick volume in FX and crypto.
- Breakout candles—single bars that smash through resistance or support with authority.
When you see that kind of action? Get ready. That is your call to action
5. Candle Structure in Waves 1 & 3 vs. 2 & 4
Waves 1 and 3? You want strong-bodied candles, minimal wicks. These are trend-confirming.
Waves 2 and 4? Expect noise—inside candles, Doji’s. These are market pauses, not reversals. They highlight indecision.
Read the candles:
- Strong = impulse.
- Erratic = correction.
Master this, and you will stay in trades longer—and exit cleaner.
6. Big Picture Analysis: Know Where You Are
Zoom out. Always.
The market is fractal—Elliott Wave patterns exist at every timeframe. But to know whether you are catching a major trend or just a correction, you need to do higher-timeframe analysis.
I call this Big Picture Analysis. Here is how:
- Start at the daily chart.
- Identify the current wave cycle.
- Drill down to the 4H or 1H for entry.
Big waves deliver big profits. Stay aligned with the medium-term picture.
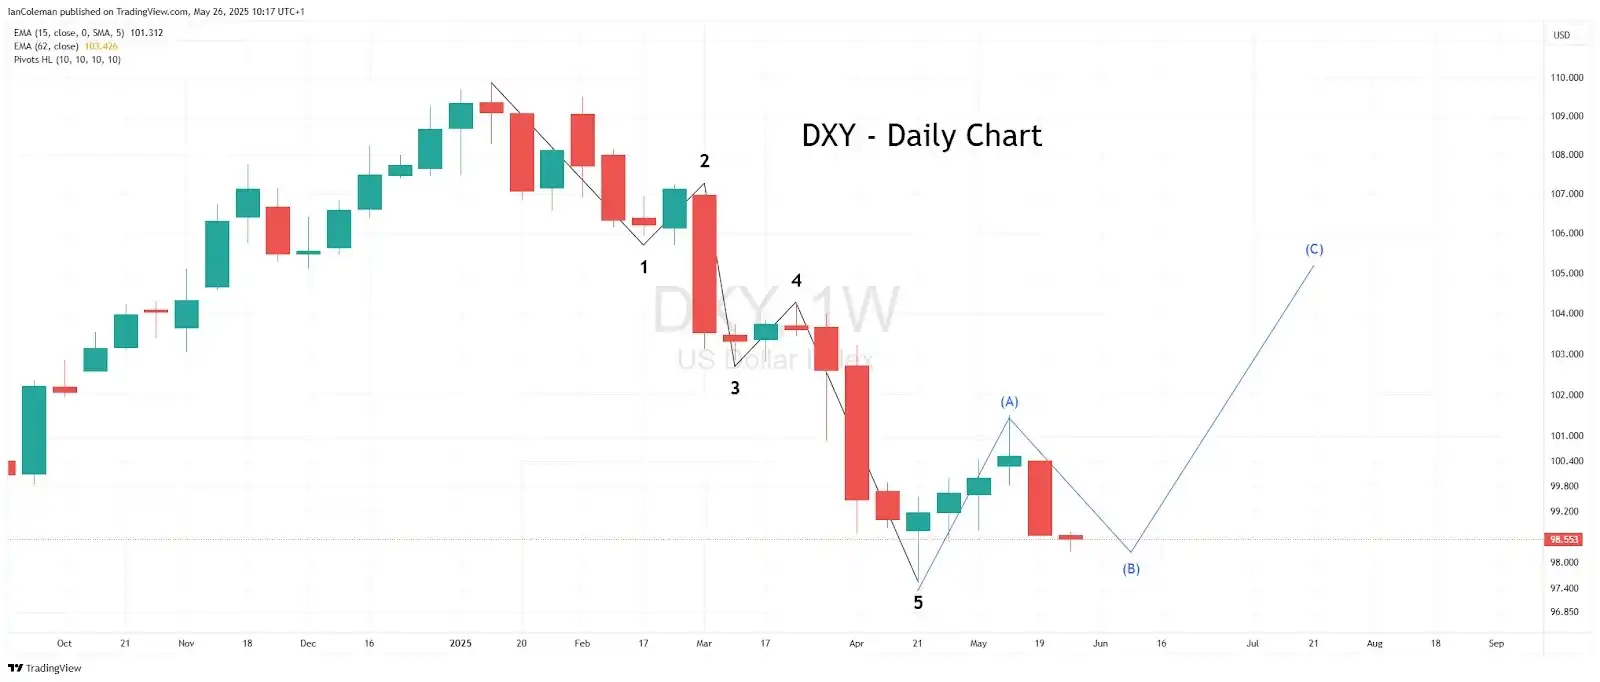
7. Confirming an End: The Wedge and Head and Shoulders
We have seen an impulsive move to the 261.8% extension level. How do we know if this is the end of a trend and the start of a correction in the other direction?
We will normally see:
- An Ending Wedge formation.
- A Head and Shoulders pattern.
It is common to see a combination of both.
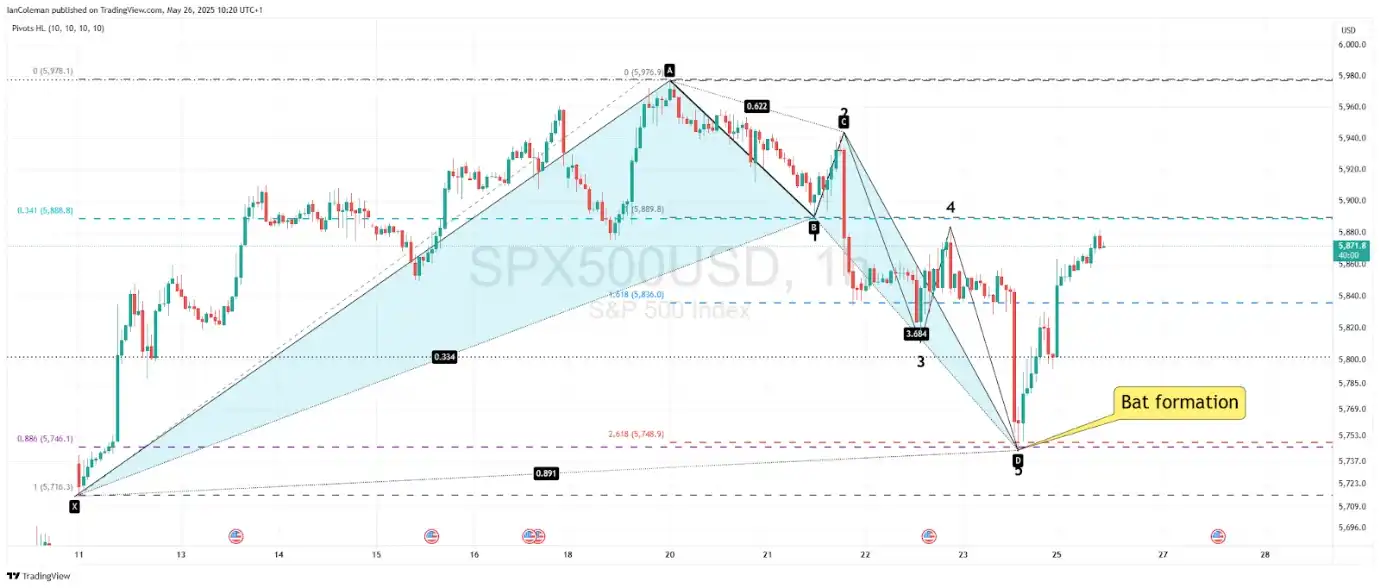
8. The Bat Formation: Harmonics + Elliott = Confidence
Want extra confidence in your setup? Look for harmonic patterns—especially the Bat formation.
The Bat is often combined with the Elliott Wave theory, offering a second layer of confirmation. It is based on Fibonacci ratios and delivers powerful reversal signals.
We will explore harmonic trading in detail later, but for now, just know: when harmonics and Elliott align, pay attention.
🔚 Final Thoughts: Build Structure, Trade with Confidence
Most traders lose because they chase price without understanding the structure. Elliott Wave is not about being right all the time. It’s about being prepared—knowing your entry, your stop, and your target before you hit the trade button.
If you are a smart trader who values logic over luck, Elliott Wave should be one of your weapons of choice.
Frequently Asked Questions (FAQs)
1. What is the Elliott Wave Theory in trading?
The Elliott Wave Theory is one of the most powerful technical analysis frameworks that identifies repetitive wave patterns in market price action. These patterns help traders forecast market direction and structure high-probability entries and exits.
2. How can implementation of Elliott Wave improve my trading strategy?
By using Elliott Wave theory, traders gain a structured system for entering and exiting trades based on wave cycles and Fibonacci extensions, increasing consistency and reducing emotional decisions.
3. What is a Wave 2 to Wave 5 trade setup?
The Wave 2 to Wave 5 setup involves entering just after Wave 2 ends and riding the impulsive Wave 3 and Wave 5. It’s considered one of the highest probability trades in Elliott Wave analysis.
4. How do I use Fibonacci with Elliott Wave Theory?
Fibonacci tools are used to project target zones in Elliott Wave trading,
5. Can I combine Elliott Wave with other technical patterns?
Yes. Combining Elliott Wave with harmonic patterns like the Bat formation, or reversal patterns like Head and Shoulders, offers additional confirmation and improves accuracy of the trade.
Disclaimer: All information provided on this site is for educational purposes only, related to trading in financial markets. It is not intended as financial advice, business or investment recommendation, or as an opportunity or recommendation to trade any investment instruments. Hola Prime only provides an educational environment to traders, including tools, materials and simulated trading platforms which have data feed provided by Liquidity Providers. The information on this site is not directed at residents in any country or jurisdiction where such distribution or use would be contrary to local laws or regulations.