Divergences are mismatches between price and indicators. Normally, if price is making higher highs, you’d expect momentum indicators to also show strength. When they don’t, it creates a divergence. That “gap” between price action and momentum is what traders pay attention to.
Why Divergences Matter in Trading
If you have ever looked at a chart and thought, “Something does not add up here,” you were probably identifying a divergence. In basic terms, divergence happens when the price is moving in one direction while your indicators (like RSI or MACD) are moving in the opposite direction. A divergence is an indication that the momentum behind the move might be waning.
For funded traders and retail traders alike, investigating divergences can help avoid chasing weak breakouts, as well as give you a better feel when you think the market could be due for a slowdown or reversal. Let’s go through this process step by step and see how you can employ divergences for yourself.
Two Main Types of Divergence You Should Know
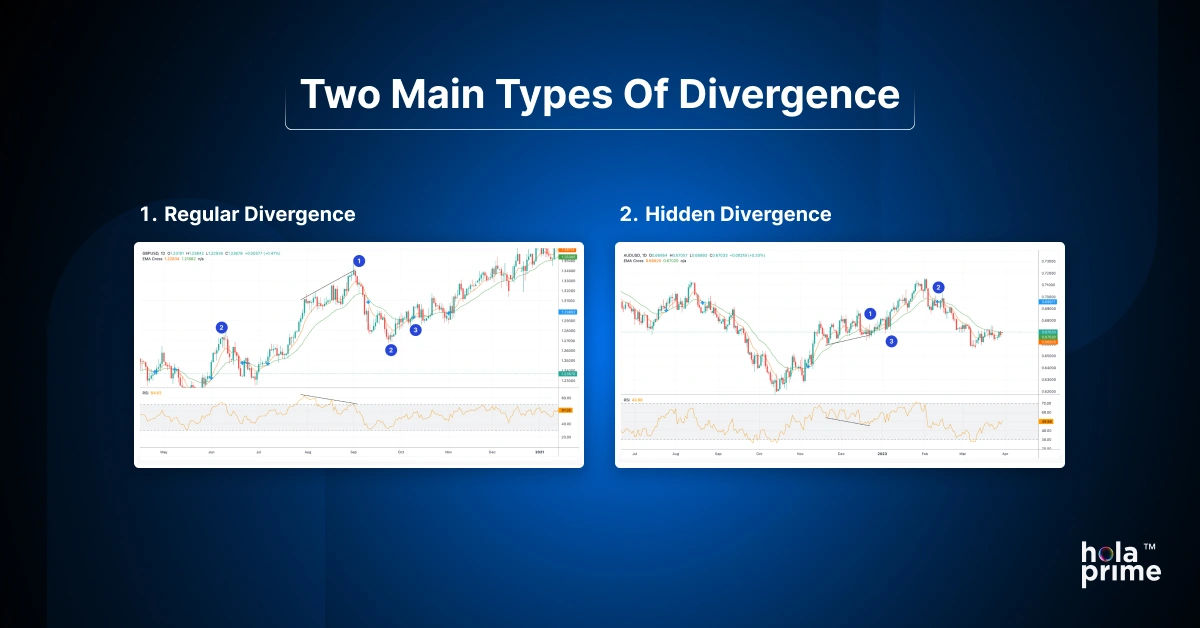
1. Regular Divergence (Reversal Signal):
This is the classic form of divergence. If price makes a new high but RSI or MACD makes a lower high, it may signal a potential reversal downward. Similarly, if price makes a new low but the indicator shows a higher low, it can hint at an upcoming bounce.
2. Hidden Divergence (Trend Continuation Signal):
Hidden divergence suggests the underlying trend still has legs. For instance, in an uptrend, if price makes a higher low but RSI makes a lower low, it may mean buyers are still in control and the trend could continue.
Why RSI and MACD Are Commonly Used for Divergence
RSI (Relative Strength Index) measures the speed of price movements, which makes it handy for spotting when momentum is running out of steam. MACD (Moving Average Convergence Divergence) looks at the relationship between moving averages, making it great for gauging broader momentum shifts.
Used together, they complement each other - RSI catches smaller, short-term moves while MACD paints the bigger picture.
Practical Ways to Trade Divergences
One of the easiest ways to see the value of divergences is to put them side by side with market structure. Take a simple example: EUR/USD drifts lower for hours, printing fresh lows each time, yet your RSI refuses to follow along and instead starts creeping upward. If that move happens right near a strong support level you’ve already marked, you don’t need an advanced model to tell you something is off. Sellers are pushing, but they’re clearly not pushing with the same conviction.
On the flip side, consider a rally in the S&P 500 futures where price is breaking new intraday highs, but the MACD histogram is steadily declining. Add in the fact that this new high is brushing against a resistance level from the previous week, and you suddenly have a much more complete story. The chart is telling you: yes, price is going up, but the fuel behind it is thinning out. That’s often where smart traders step back, reduce exposure, or even look for a short-term reversal play.
The main lesson here is that divergences are not “signals” in isolation. They are nudges, warnings, or hints that the surface move is not as solid as it seems. If you can combine them with levels, patterns, or broader market context, they turn from being just a chart curiosity into a tool you can actually trade.
Mistakes Traders Commonly Make
A common pitfall is treating divergences like magic arrows pointing to reversals. Markets don’t bend just because RSI or MACD disagrees. Sometimes a divergence drags on for days before price finally shifts, and in the meantime, an impatient trader racks up losses.
Another mistake is ignoring the bigger picture. For example, spotting a bearish divergence on a 15-minute chart in the middle of a strong daily uptrend doesn’t carry the same weight as seeing that same divergence at a key weekly resistance zone. Context is everything.
Traders also tend to overuse them. Divergences should complement your setup, not be the entire reason for it. Think of them as one part of a checklist rather than a trading strategy on their own.
Tips for Getting Better at Divergence Trading
The best way to improve is through practice and observation. Start marking divergences on historical charts and note what happened afterward. Did price reverse right away, or did it grind sideways first? How often did the move align with strong support or resistance? These notes will become a personal guidebook over time.
It also helps to use both RSI and MACD instead of relying on just one. Sometimes RSI will pick up a subtle change in momentum, while MACD offers better confirmation of the broader trend. When both point to the same story, the probability of the setup improves.
And as always, risk management comes first. Divergences can and do fail, so having clear stop-loss levels makes the difference between a small scratch and a painful loss.
Conclusion
At the end of the day, divergences are less about calling tops and bottoms and more about giving you a second opinion on what price is really doing. They serve as that quiet reminder to pause and ask, “is this move still backed by strength, or is it starting to fade?” When you use them alongside levels you’ve already marked, trend direction, and a healthy respect for risk, they become a tool that adds clarity rather than confusion.
Each trader will establish their own relationship with indicators and divergences with RSI or MACD are no exception. The more you observe these divergences occur in real time, the better you will become in knowing when they are worth taking notice of, or to ignore them as part of the daily market background noise. With time and practice, divergences can go from being an interesting chart pattern to an integral part of your decision-making.