Before jumping into specific indicators, remember this: no indicator works or promises profits. Indicators do not work like magic. They are more like lenses helping you view the market in new ways. Learning to use them with good risk management can guide you to trade more and with discipline.
This post dives into five essential forex indicators every funded trader needs to understand. Whether you’ve just started trading or are managing a funded account, these tools are crucial. They address the main elements of trading like trends, momentum, market volatility, and significant price levels. By the end, you’ll grasp what these indicators are and how they fit into your strategies.
Why are Technical Indicators Important in Trading?
Forex indicators use math formulas to process price and volume data. They convert raw price changes into easier-to-read signals. Imagine looking at candlestick charts as trying to read in an unfamiliar language. Indicators work as translators to reveal trends, momentum changes, and possible market reversals more.
Funded traders treat indicators as an important tool. Using someone else's money means proving you can stay consistent. Guesswork or emotional choices won't cut it. You need a clear plan to avoid impulsive moves. Indicators give that plan shape. They show you the right moments to enter trades, set stop points, and choose exits. This adds more order to your trading approach.
Here’s the thing: you can’t just use indicators without thinking. A lot of beginners make the mistake of piling ten different indicators onto their charts. Then, when some suggest "buy" while others scream "sell," they end up lost. The real trick is to master a handful of crucial indicators and combine them with price action. In this blog, we’re not just throwing out a list of indicators. Instead, we’ll focus on five key ones that address the most important parts of trading.
Top 5 Technical Indicators in Forex Trading:
1. Moving Averages:
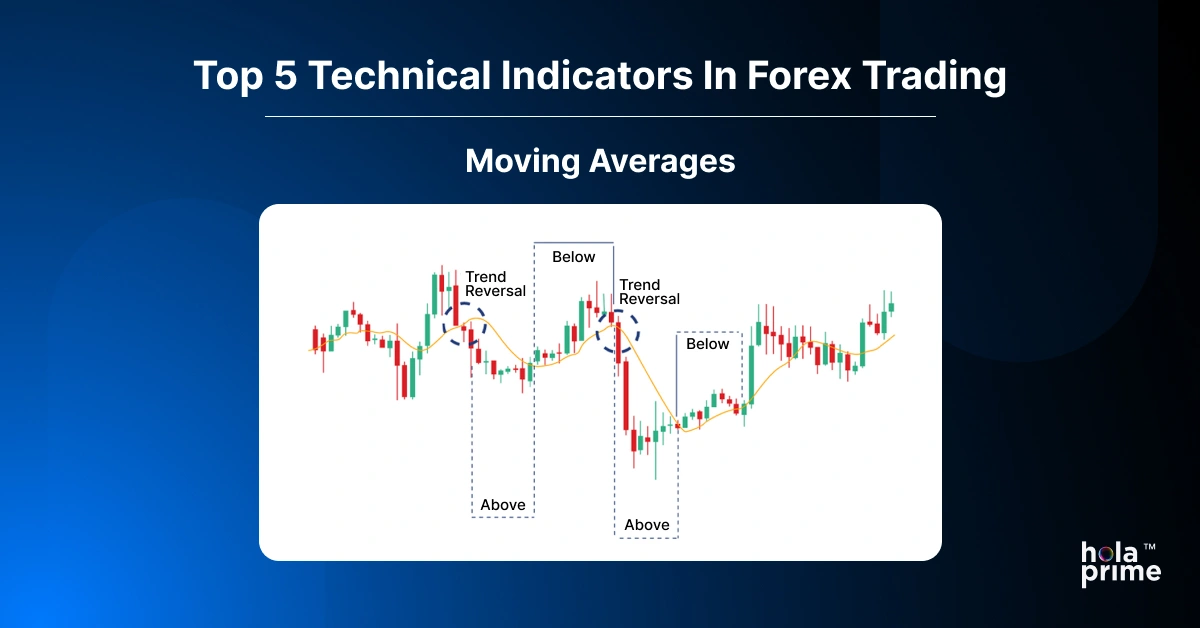
Most traders dive into moving averages first, and it makes sense why. They help make sense of price changes by simplifying movements. Instead of focusing on minor ups and downs, traders can see the overall market direction more clearly.
Moving averages fall into two main categories: simple moving averages (SMA) and exponential moving averages (EMA). The SMA spreads its focus across all price points, while the EMA pays closer attention to recent prices, adapting faster to changes. Many funded traders lean towards EMAs since they catch sudden market changes better.
How do traders apply moving averages in real situations?
One method involves seeing if the price stays above or below the average line. When the price remains above the EMA, it signals a bullish trend. If the price falls below it, the trend tends to be bearish. Another popular way traders use moving averages is by watching crossovers. For instance, if a short-term EMA crosses above a long-term EMA, it can indicate a possible uptrend.
Traders also rely on moving averages as flexible support or resistance zones. Prices often pull back to an EMA during a trend before continuing in the same direction. This makes moving averages useful to plan entries and exits in trades. However keep in mind they are lagging tools - they reflect price movements after they happen. Because of this, they work better to confirm trends instead of predicting future ones.
2. Relative Strength Index (RSI)
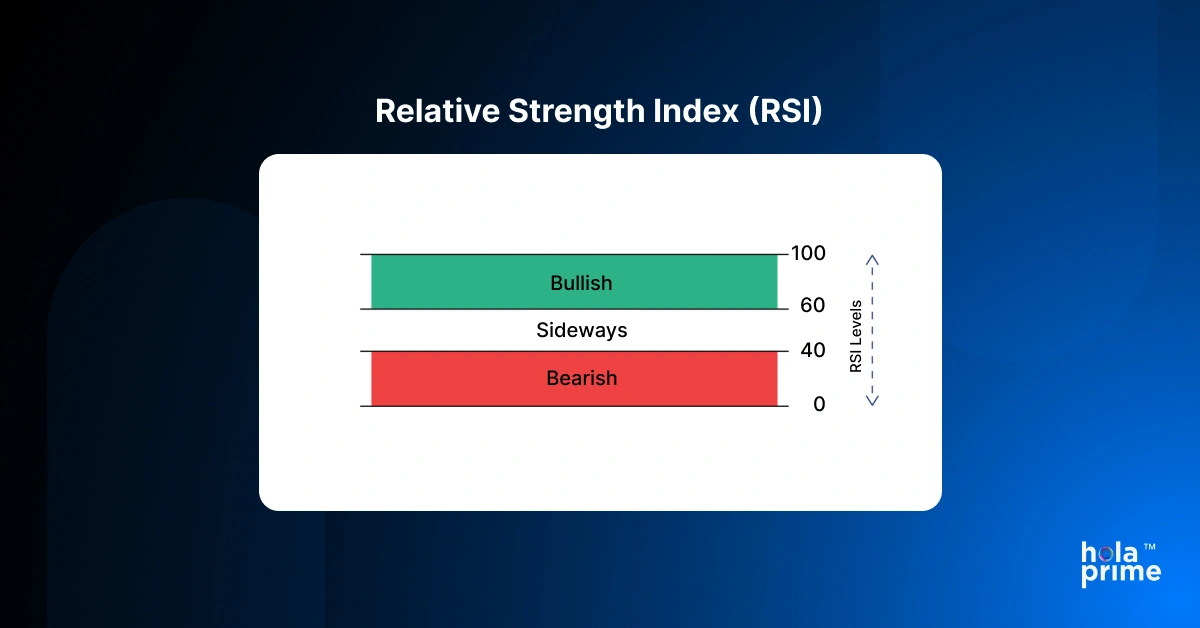
The Relative Strength Index, or RSI, is a simple but effective momentum tool. It shows how fast and strong price moves are by using a scale from 0 to 100. Traders pay attention to 30 and 70 on this scale. If the RSI dips under 30, it shows the asset might be oversold, which implies too much selling has happened and prices could bounce back. If it rises over 70, it signals the market might be overbought, pointing toward a possible price drop or adjustment.
Here's a mistake lots of traders make - they think RSI always signals a market reversal. The truth is different. During strong trends, RSI can remain in the overbought or oversold range for extended periods. In a strong upward trend, RSI might stay over 70 for days, maybe even weeks. Selling each time it moves past 70 could result in losses.
How can funded traders make use of RSI?
A better way is to pair it with the trend. During an uptrend, traders can treat RSI dips to 30 - 40 as chances to buy. In a downtrend, RSI climbing to 60 - 70 might show solid points to short. Instead of just responding to oversold or overbought signals, traders should use RSI to plan better entries within the larger trend picture.
3. MACD (Moving Average Convergence Divergence)
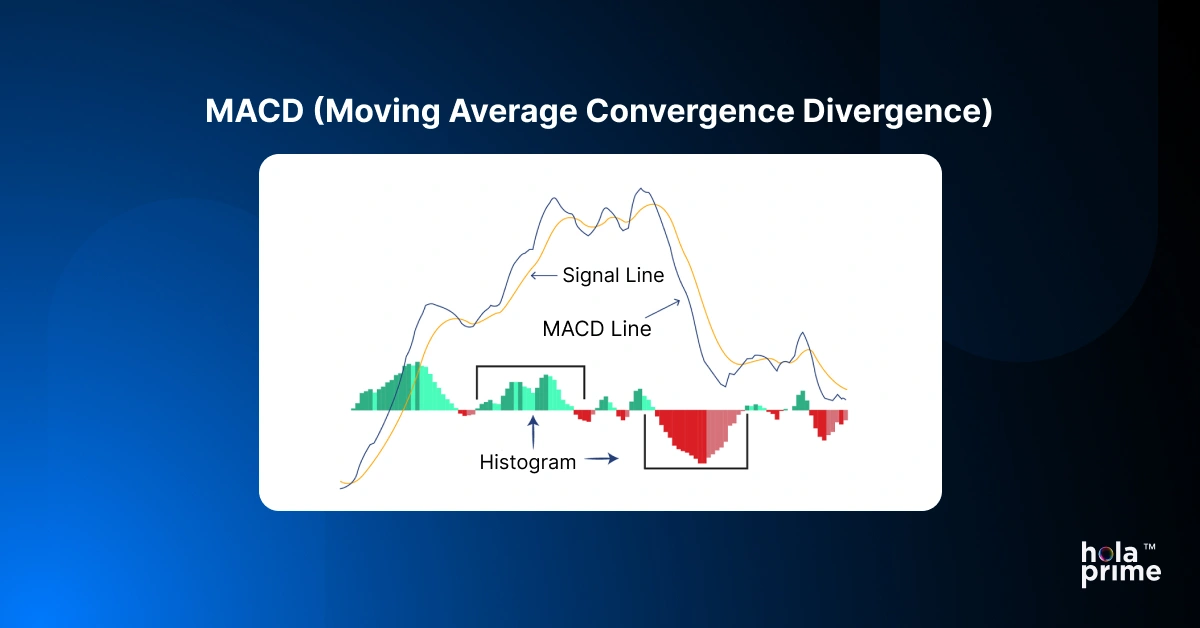
The MACD shows a mix of moving averages and momentum in trading. It includes two main lines called the MACD line and the signal line, as well as a histogram showing their difference. When the MACD line moves above the signal line, it points to bullish momentum. When it dips below, it indicates bearish momentum.
What sets MACD apart is its ability to reveal both trend direction and strength. To funded traders, this matters because spotting strong momentum can boost your risk-to-reward potential. For instance, if MACD supports momentum following a breakout at a key level, it can give you added confidence to stick with your trade.
Another advantage of MACD lies in its divergence signals. Divergence shows up when the price forms higher peaks, but the MACD shows lower peaks, or vice versa. This can alert traders to a weakening trend and hint at a possible reversal. Still, like any other indicator, traders should pair divergence with tools like support or resistance levels rather than relying on it alone.
4. Bollinger Bands
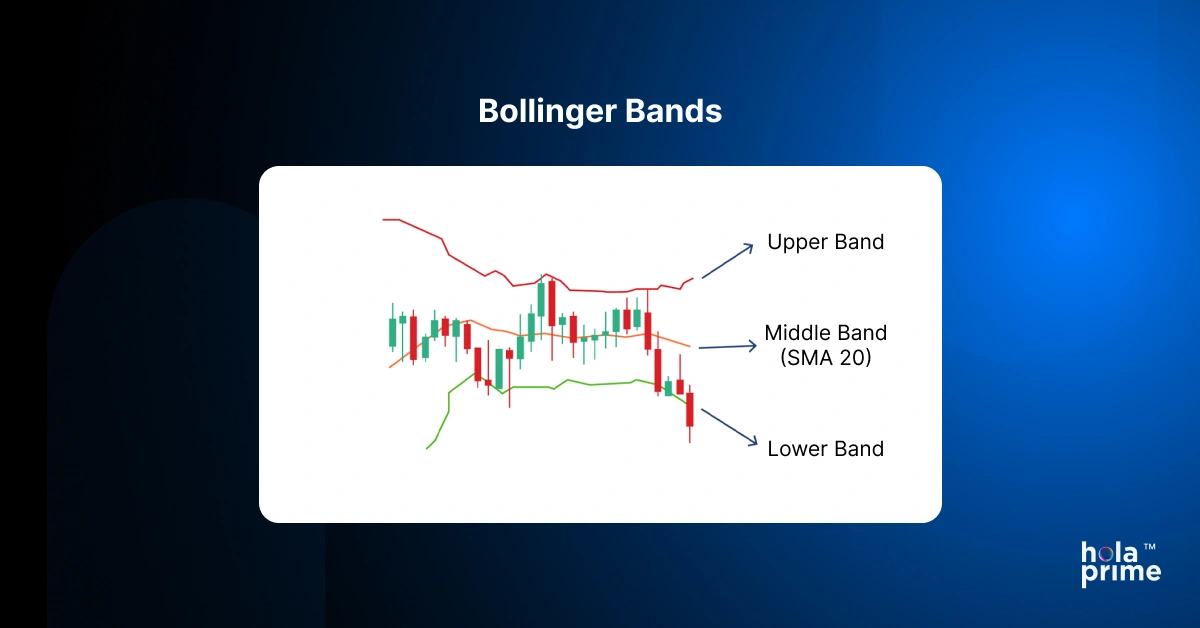
Bollinger Bands help traders to grasp volatility better. These bands include a middle moving average with an upper and lower band that sit two standard deviations apart. Expanding bands signal rising volatility, while contracting bands point to calmer low-volatility periods.
How do funded traders put these tools to work? A popular trick they use is spotting "squeezes." When the bands get close together, it signals a calm market with low volatility that often comes before a breakout. Traders get ready at this point, expecting a big market move in either direction. They also check for overextended prices. If the price hits or moves past the bands, it shows the market might be stretched and could soon pull back toward the average.
Bollinger Bands serve as a useful tool because managing risk is critical for prop traders. If you know when volatility might increase, you can dodge unexpected breakouts or, even better, set yourself up to catch the breakout.
5. Fibonacci Retracement Levels
Traders often draw lines on their charts at odd percentages like 38.2 and 61.8. These lines come from the Fibonacci sequence, a math pattern seen in nature. They surprisingly align well with market movements.
The concept here is simple. When prices make a significant move, they tend to pull back a bit before resuming their path. Fibonacci levels show where those pullbacks might land. Traders focus on 38.2, 50, and 61.8 as the key percentages to watch.
Traders rely on Fibonacci levels to identify possible zones of support and resistance. For instance, when the market experiences a strong rally and then begins to pull back, applying Fibonacci retracements to that movement can help predict where buyers could return. These are not precise points but rather areas to watch, so traders should seek extra signals like volume changes or candlestick formations before making a trade.
Using Technical Indicators in Trading:
Though these are the top 5 forex indicators, there are many more too. These made the space in this list as they are widely used by forex traders of all levels. Whether a beginner or an advanced trader, they use indicators like moving averages and others. Moreover, it is important to understand that every indicator is unique in its function, and to get the best results, you should always check the signals with more than 1 indicator. For instance, if the RSI of a pair is above 70 and you think that the price would go down, it’s a good idea to check with other indicators like MACD or Bollinger Bands to confirm the signal.
Here, you should also keep in mind that overloading your charts with technical indicators is also not good. You have to keep a mix of primary indicators to get the signal and a secondary indicator to confirm that signal. If you have too many indicators, they might do no good and end up making you confused.
Common Mistake Traders Make with Indicators
Indicators can be useful, but they often lead to trouble when used with half-knowledge. Many traders fall into "analysis paralysis, where they overload their charts with too many indicators and end up confused by mixed signals. Others make the error of depending on indicators while ignoring price action. Since indicators are based on price, overlooking candlesticks is like ignoring the foundation of the data.
Conclusion:
Indicators aren’t magic answers, but they can work as great tools if you know how to use them. To succeed as a funded trader, understanding five key ones - moving averages, RSI, MACD, Bollinger Bands, and Fibonacci retracements - helps you build a solid base. These tools let you study trends, find chances, and handle risks better.
Their true strength isn’t in using them one at a time. Instead, pairing them up with price action and smart risk control makes them way more effective. Keeping things simple, sticking with reliable tools, and not filling your charts with too much noise will let you trade with more clarity. That’s what most funded traders aim to achieve.