Candlestick patterns show you the battle between buyers and sellers in real time. They tell you who’s winning, who’s losing, and when the tide might be about to turn. In this blog, we’ll go through the most important candlestick patterns every prop trader should master, how to use them effectively, and what mistakes to avoid if you want to trade like a pro inside an evaluation challenge.
Why Candlestick Patterns Matter in Prop Trading
Most prop firms want to see one thing above all: control. It’s not about taking massive risks or catching 200-pip moves - it’s about managing entries, exits, and risk in a structured way. Candlestick patterns are one of the most reliable tools to do that because they let you read market intent without cluttering your screen with lagging indicators.
When you trade prop challenges, you usually have fixed daily drawdown and maximum loss limits. That means every decision counts. Knowing when the market is rejecting a level or losing momentum can help you avoid risky entries. For example, if you see a bearish pin bar rejecting resistance, it might stop you from going long too early. This level of awareness not only protects your capital but also increases your chances of consistent profitability - something every prop firm values.
Anatomy of a Candlestick (Quick Refresher)
Before we dive into different kinds of candlesticks, let’s first relearn what exactly candlesticks are. You may already have an idea about it, but it’s never a bad idea to revise our knowledge. So a candlestick shows four different prices: the ‘open price’, the close price’, ‘the high’, and ‘the low’. The body of the candlestick shows the opening and the closing price of that time frame, and the wicks show how high and low the price fluctuated during the given period.
A long wick often signals rejection, meaning the price tested a level but failed to stay there. A small body shows indecision or balance between buyers and sellers. Once you start viewing candlesticks this way, you’ll realize that every pattern is just a reflection of how traders are reacting to the price at a given level.
The Most Important Candlestick Patterns for Prop Traders
1. Pin Bar (Rejection Candle)
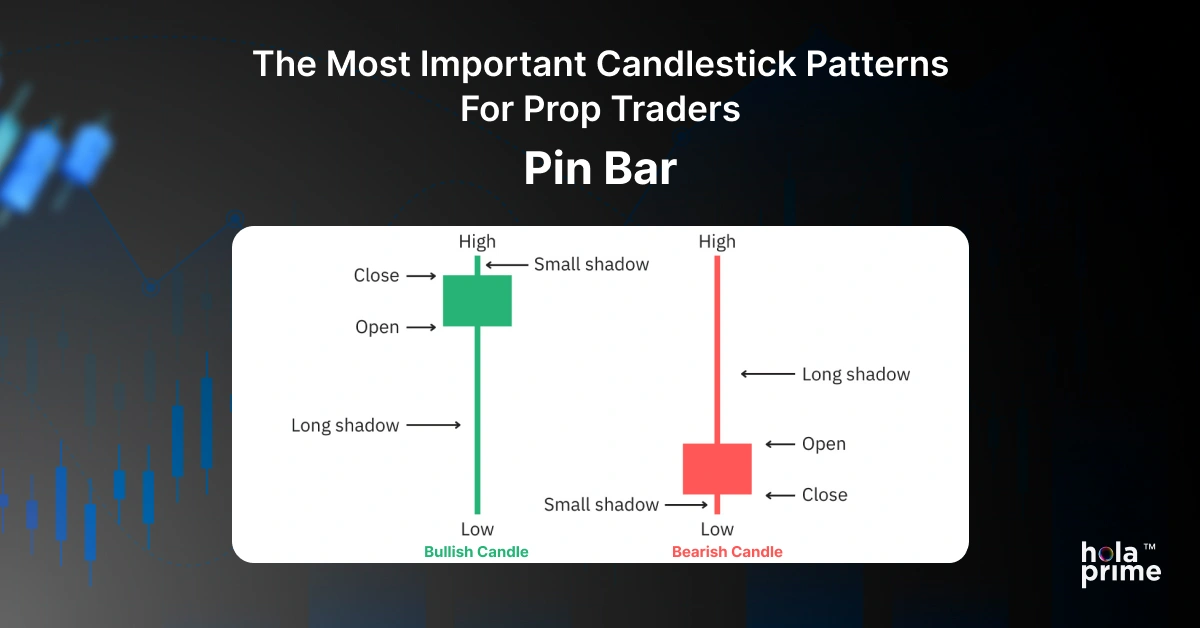
The pin bar, sometimes called a rejection candle, is one of the most powerful price action signals. It forms when price moves strongly in one direction but quickly reverses, leaving a long wick and a small body. The wick shows where the market rejected a level, and the direction of the body shows who took control by the close.
For example, if you’re trading gold during the New York session and see a long upper wick with a small bearish body near a resistance zone, that’s a bearish pin bar. It tells you that buyers tried to push the price up, but sellers stepped in aggressively. Many prop traders use pin bars to identify exhaustion points where momentum might flip.
2. Engulfing Pattern
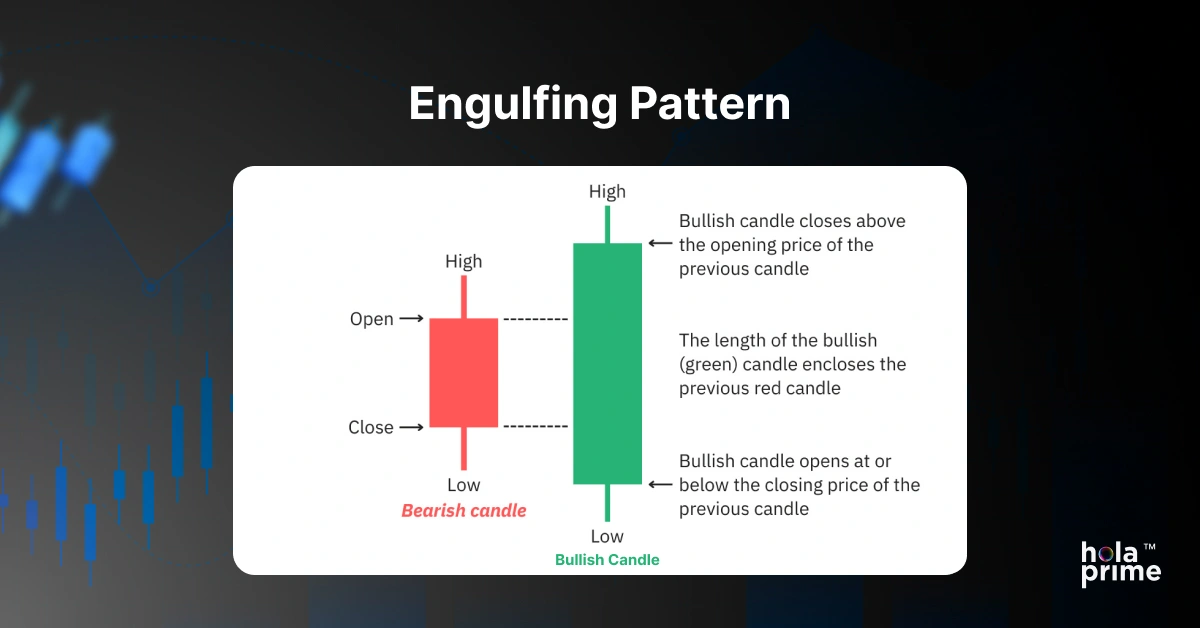
An engulfing pattern appears when a candle completely "engulfs" the body of the prior candle. A bullish engulfing pattern is when a strong bullish candle closes above a previous bearish candle to signal a potential bull trend. On the flip side, a bearish engulfing candle is a strong indication of selling pressure overcoming the previous buying pressure.
Let’s say you are trading EURUSD and after a number of red candles, you see a nice, big green candle that closes above the previous high. This is a bullish engulfing candle, which signifies that buyers have regained control. In prop challenges, these patterns can provide a helpful means to gaining confidence in your timing of reversals, especially at significant support and resistance zones.
3. Doji Candle
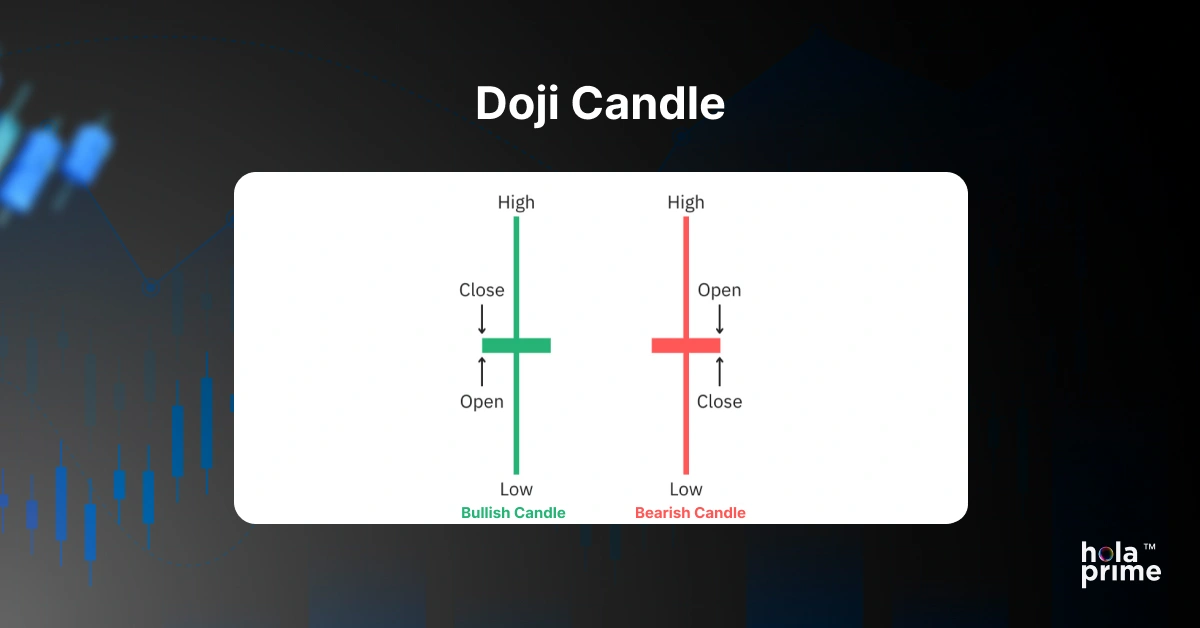
The doji is the candle of indecision. It forms when the open and close are almost the same, creating a small or non-existent body with long wicks on either side. It tells you that neither buyers nor sellers were able to dominate.
A doji on its own does not hold much meaning, but the context is everything. For example, if a doji appears following a strong bullish move, this could indicate that the uptrend is losing steam, allowing you (in prop trading) to tighten stops, exit a position, or wait for confirmation to buy again.
4. Morning Star & Evening Star
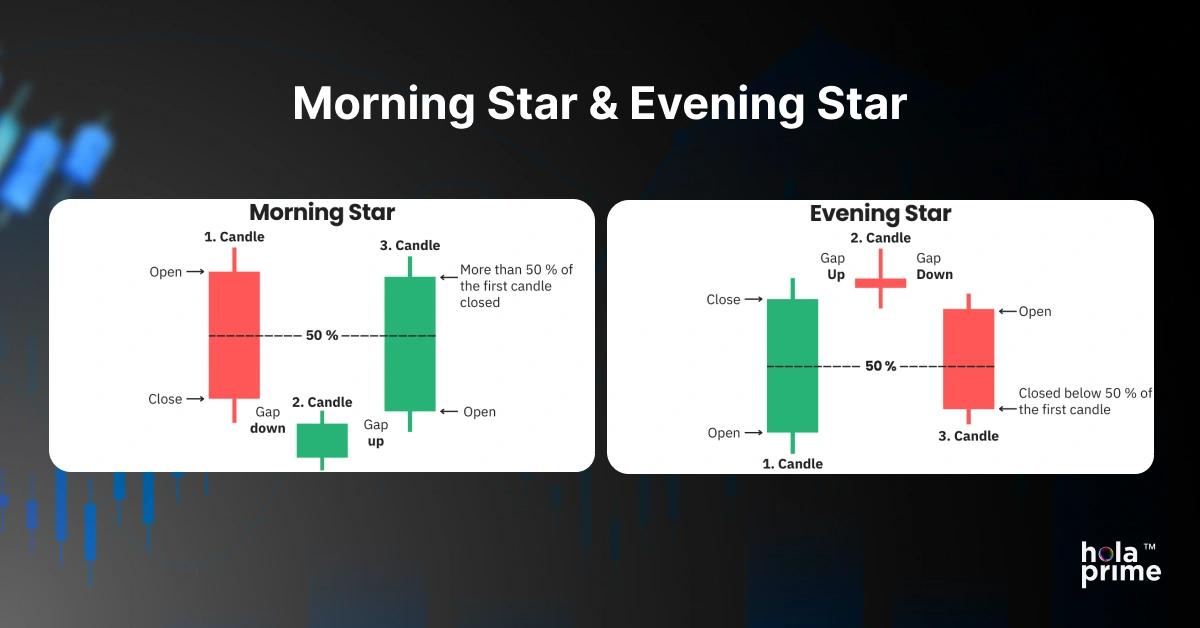
These are three-candle reversal patterns that show evidence of a reversal in direction. A morning star will appear at the bottom of a downtrend, indicating a potential bullish reversal. An evening star is indicative of a bearish reversal at the top of an uptrend.
Let’s say crude oil has been selling off for several days. Then you see a strong bearish candle, followed by a small-bodied candle (indecision), and then a large bullish candle that closes above the midpoint of the first one. That’s a classic morning star setup. Prop traders often use it to anticipate early reversals before indicators like RSI or MACD even react.
5. Inside Bar
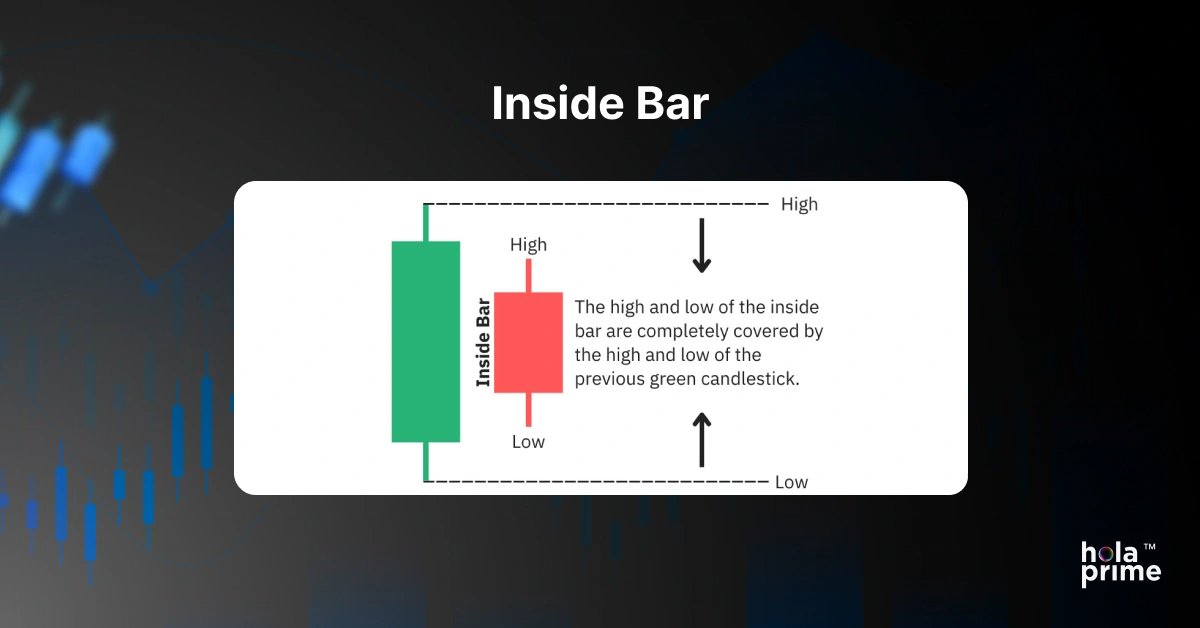
The inside bar candle is a smaller candle that is formed completely within the range of the previous candle. It can indicate price consolidation or indecision before a breakout. Prop traders love inside bars because they can often lead to a bigger move, especially in high-volume sessions such as London or New York.
If you see an inside bar forming during an uptrend, it can mean the market is taking a break before moving to the upside. Some traders will simply have their buy stops above the high of the mother bar (the bigger previous candlestick), and have their sell stops below the low of the mother bar. This way, they catch breakouts in either direction with controlled risk.
6. Hammer and Shooting Star
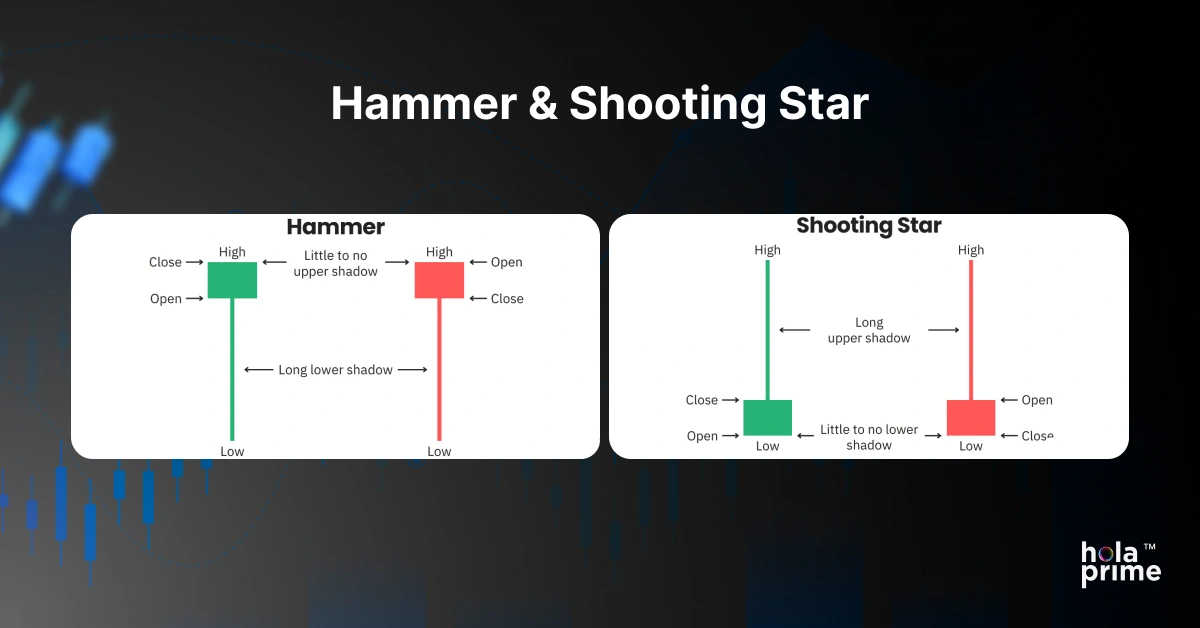
A hammer forms at the bottom of a downtrend and signals a potential reversal. It has a small body with a long lower wick, showing that sellers pushed the price down, but buyers came back strongly. A shooting star is the opposite - it forms at the top of an uptrend with a long upper wick, showing rejection from higher prices.
For example, if you’re watching GBPUSD and a hammer appears near a daily support zone during the London session, it may hint at a reversal. Combined with a confirmation candle, this setup can provide low-risk entries with tight stop-loss levels - perfect for prop traders who must protect their drawdown.
How to Use Candlestick Patterns with Market Context
No candlestick pattern works in isolation. The same pin bar that signals a reversal in one area can mean nothing in another. What gives these patterns power is context - where they form and under what conditions.
For instance, a bullish engulfing pattern forming at a strong support level after a long downtrend carries more weight than one appearing in the middle of a range. You should also pay attention to market sessions. A doji formed during the Asian session might not hold the same value as one that appears at the start of the London session when volatility kicks in. Prop traders who combine candlestick reading with support-resistance analysis and timing tend to make more consistent decisions.
Mistakes Traders Make with Candlestick Patterns
A common mistake that many traders make is treating candlestick patterns as guaranteed signals rather than indications. Some traders jump in on every pin bar or engulfing candle without waiting for confirmation or checking the bigger picture. This often leads to false entries and unnecessary losses.
Another issue is overconfidence in isolated setups. For example, a shooting star in an uptrend might tempt you to short, but if the overall trend is strong and supported by fundamentals, the price might keep pushing higher. Prop traders especially need to avoid this trap because one wrong trade can easily hit the daily drawdown. Always pair candlestick patterns with proper confirmation and risk management.
Combining Candlestick Reading with Risk Management
Candlestick analysis becomes powerful when you combine it with smart risk management. Each pattern gives clues about where to place stops or take profits. For instance, if you enter a trade after a bullish engulfing, placing your stop just below the pattern’s low keeps your risk tight.
Risk structure is paramount during prop challenges. By implementing candlestick setups for clearer entries, you can manage smaller stop losses and maintain better reward-to-risk ratios. This translates into hitting targets more often, even if you only have a few winning trades, without hitting drawdown limits. The focus is not on trading every pattern, but rather the best patterns at the best time, while keeping risk under your control.
Final Thoughts
Mastering candlestick patterns takes time and observation. It’s not about memorizing shapes but understanding what they represent - the constant tug-of-war between buyers and sellers. Once you see candles as a reflection of trader psychology, the market starts to make much more sense.
For prop traders, this skill becomes even more valuable because it helps you react with precision under strict trading conditions. Focus on context, keep your risk structured, and treat candlestick reading as part of your overall edge. With enough practice, you’ll start seeing setups that most traders completely overlook.