If you’ve ever traded more than one forex pair at a time, you’ve probably noticed something strange.
You open a buy on EUR/USD, and a few minutes later, GBP/USD starts rising too. Or you short USD/CHF, and suddenly EUR/USD shoots up.
If you’ve ever traded more than one forex pair at a time, you’ve probably noticed something strange.
You open a buy on EUR/USD, and a few minutes later, GBP/USD starts rising too. Or you short USD/CHF, and suddenly EUR/USD shoots up.
It’s not luck. It’s not a coincidence.
It’s correlation - that invisible web that connects every pair, every market, every decision.
The truth is, the forex market is one big conversation between currencies. They move together, they react to the same events, and they often mirror each other in ways you don’t expect.
And once you learn how to listen to that conversation - how to read the rhythm behind it - trading starts making a lot more sense.
That’s what this guide is about. Understanding correlation isn’t just about statistics or data.
It’s about awareness.
It’s about knowing when one trade secretly controls another, when your “diversified” positions are actually identical, and when you’re unknowingly doubling your risk.
In simple human terms, correlation is how two currency pairs move together.
If they rise and fall in the same direction most of the time, they’re positively correlated.
If one rises while the other falls, they’re negatively correlated.
And if they don’t seem to care what the other is doing, that’s no correlation.
We usually measure this on a scale from -1 to +1.
But correlation in forex isn’t just math. It’s a reflection of global behavior.
It’s how economies influence each other, how sentiment spreads, and how traders around the world, from banks to individuals, collectively move capital.
When you start thinking of forex in those terms, charts begin to feel less like random waves and more like stories being told in parallel languages.
Let’s be real - most traders think they’re diversified when they’re not.
You might have three trades open - EUR/USD, GBP/USD, and AUD/USD, and feel safe because they’re different pairs.
But if all three share the U.S. dollar, they’ll likely react to the same news, the same sentiment, and often in the same direction.
So when the dollar strengthens, all three might fall together, and suddenly your “three trades” are really one big position.
Understanding correlation keeps you from that trap. It helps you:
When you respect correlation, you trade smarter.
You start managing relationships - not just positions.
Every currency is part of an economy. And every economy is connected through trade, interest rates, and global confidence.
That’s why currencies rarely move alone.
When the U.S. dollar rises, it usually pushes several other pairs down. When oil prices surge, the Canadian dollar strengthens. When risk appetite grows, the Australian and New Zealand dollars often climb together.
It’s not random. It’s the world breathing in rhythm.
If you’ve ever seen multiple pairs moving almost identically after big news, that’s correlation in action. It’s the market’s collective heartbeat showing up across charts.
Think of positive correlation as two friends walking in the same direction.
If one speeds up, the other keeps pace.
That’s EUR/USD and GBP/USD. They usually rise and fall together because both are measured against the U.S. dollar.
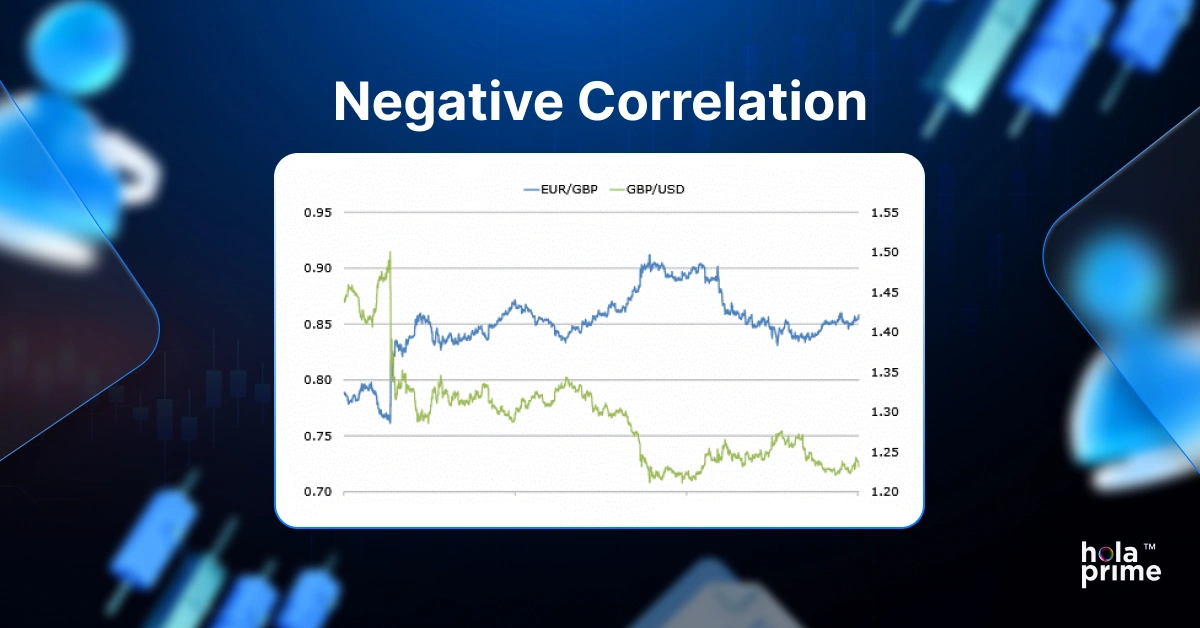
Now think of negative correlation as two people on opposite ends of a seesaw.
When one goes up, the other must come down.
That’s EUR/USD and USD/CHF - their movements often mirror each other because when traders buy euros, they often sell Swiss francs as part of risk rotation.
Once you start recognizing these relationships, you stop being surprised by market moves - you start expecting them.
Now, not every pair shares a connection.
Some don’t really care what the others are doing.
These are uncorrelated pairs and are your secret weapon for true diversification.
Let’s say you’re trading USD/JPY (driven by U.S. yields and Japanese sentiment) and AUD/NZD (driven by commodity prices and Pacific trade).
They don’t dance to the same rhythm. So even if one trade goes wrong, the other might stay steady.
That’s the magic of diversification - not just opening random trades, but balancing exposure across different stories.
When traders talk about correlation pairs in forex, they’re simply referring to how different currency pairs behave in relation to each other.
Here are some easy-to-remember examples:
Once you start seeing these pairs as connected, not separate, your trading logic sharpens. You stop doubling exposure by mistake. You start thinking like a strategist - not just a trader chasing candles.
Let’s bring some color into this:
These relationships can help confirm your setups or warn you of duplication. Either way, they make your analysis richer.
This is the poster child of positive correlation.
Both pairs involve the U.S. dollar, both represent major Western economies, and both react to global dollar flows.
If you’ve ever seen both pairs spike after weak U.S. data, that’s correlation at work.
But there’s nuance here - sometimes the euro reacts stronger than the pound, especially around ECB or Bank of England news.
Understanding those subtleties can make your decisions sharper, more intentional.
Both gold and the Japanese yen are considered safe havens. That means when fear hits the markets, say, during geopolitical tension, traders rush to both.
So when gold prices rise, USD/JPY often falls. Why? Because money flows into the yen (pushing USD/JPY down) just as it flows into gold.
It’s a psychological pattern more than a technical one - a reflection of where people seek safety when the world feels shaky.
Australia and New Zealand share more than proximity. Their economies are built on commodities, exports, and trade with Asia, especially China.
That’s why the Aussie and Kiwi dollars tend to move almost hand-in-hand. When China’s economy grows, demand for its exports rises, strengthening both currencies. When risk sentiment drops, both fall together.
For traders, it means one thing: taking the same trade direction on both pairs is often doubling your exposure - just wearing two flags instead of one.
If you trade USD/CAD, you’re also trading oil - whether you realize it or not.
Canada’s economy depends heavily on oil exports, so when oil prices climb, the Canadian dollar usually strengthens. That means USD/CAD tends to fall.
It’s one of those consistent, logical relationships that makes sense even outside forex charts. When you see oil breaking out, you can often anticipate CAD’s reaction before the candles even form.
News is the great disruptor.
An interest rate hike from the Federal Reserve doesn’t just move the U.S. dollar - it sends ripples across every pair connected to it. When China’s manufacturing data drops, the Aussie and Kiwi both feel the impact.
That’s why correlations tighten or break temporarily around major events. The entire forex ecosystem shifts its rhythm, like an orchestra responding to a sudden change in tempo.
Here’s something traders often miss: correlation depends on the timeframe.
Two pairs might look perfectly aligned on a daily chart, but chaotic on a 15-minute chart. That’s because short-term moves often react to noise - intraday liquidity, quick profit-taking, or local sentiment shifts.
Longer timeframes smooth that out, showing the real underlying relationship.
If you’re a day trader, correlation might help with timing. If you’re a swing trader, it’s your guide to exposure management.
Short-term correlations can be messy. One headline, one surprise speech, and everything shifts for a day or two.
But long-term relationships - those built on deep economic ties - tend to hold firm.
AUD/USD and NZD/USD may drift apart after a local data release, but they’ll often reconnect later because their economies move together over time.
Good traders know how to read both.
They adapt to short-term chaos without losing sight of long-term structure.
Volatility doesn’t just move prices - it shakes relationships.
During calm markets, correlations are steady, predictable. But when panic hits - say, a banking crisis or sudden inflation spike - correlations can flip.
Pairs that usually move together might suddenly go in opposite directions, as traders scramble for safety or liquidity.
That’s why smart traders don’t treat correlation as a permanent truth. They treat it as weather - it changes, and it needs checking.
A correlation matrix is basically a map of relationships.
It’s a simple table that shows how every pair you trade connects to the others - with numbers from -1 to +1.
Each row and column represents a pair, and where they meet, you get a value showing their relationship strength.
It’s like seeing your entire trading world at once. You stop guessing which trades overlap - you see it clearly.
Professional traders don’t rely on gut feeling for correlation - they measure it.
A correlation matrix tells them which trades are secretly linked and which are truly independent.
If two pairs show a correlation of +0.90, opening trades in both means doubling your exposure.
If one pair has -0.95 correlation to another, that’s your built-in hedge.
Once you start using a correlation matrix, you stop treating your trades as isolated bets.
You start managing them like parts of a living portfolio.
You can make one in minutes:
It sounds technical, but once you’ve done it once, it’s like building your own weather forecast.
You can instantly see which pairs are moving together and which are drifting apart.
Here’s the simple interpretation:
Strongly positive = they behave almost the same.
Strongly negative = they often hedge each other.
Weak correlation = true diversification.
Visual clarity matters when you’re managing multiple positions.
That’s why traders often color-code their matrices:
At a glance, you can tell where your risk is concentrated.
It’s one of the simplest tools that separates casual traders from strategic ones.
Here’s where theory meets practice.
A correlation matrix isn’t just a colorful table - it’s a decision-making map. When you open a new trade, check your matrix. See how that pair connects with others you already have open.
If you’re long on EUR/USD and you’re thinking of buying GBP/USD too - pause. Check their correlation. If it’s above +0.8, you’re basically doubling your exposure to the same market direction. Instead, you might choose a pair with a weaker or even negative correlation to balance your book.
In short, a correlation matrix helps you ask the right question before every trade:
“Am I truly diversifying, or just multiplying the same risk?”
Most traders lose money not because their analysis is bad, but because their risk is invisible. Correlations expose that hidden layer.
You might think your portfolio has ten different trades - but if six of those pairs are positively correlated, you’re really running one big position. The correlation matrix shines light on those blind spots.
It also helps you identify which trades are likely to fail together, so you can trim, hedge, or spread your risk before trouble hits.
Diversification isn’t about adding more trades. It’s about adding different trades.
Correlation teaches you that quality diversification means mixing uncorrelated or negatively correlated assets. So if your USD-based trades are all moving together, consider mixing in pairs like AUD/NZD, EUR/CHF, or even commodities like gold to spread the exposure.
Diversification doesn’t eliminate risk - it balances it. It gives your account a better chance of surviving when one market throws a tantrum.
Many traders confuse diversification with randomness. They open trades across multiple pairs, thinking that more means safer. But that’s not how it works.
If you’re long EUR/USD, GBP/USD, and AUD/USD, you’ve technically placed three trades, but all of them depend on one thing: the U.S. dollar weakening. That’s not diversification, that’s dependency.
A correlation matrix helps you stay intentional. It reminds you that every new trade should add value to your overall balance - not just take up another slot on the chart.
Building a balanced forex portfolio is like composing a piece of music - you need harmony.
Too many instruments playing the same note? It sounds messy. Too few? It lacks depth. The key is knowing which pairs complement each other.
Using correlation data, you can create a mix of trades where gains in one area can offset potential losses in another. The goal isn’t to avoid losing trades - it’s to make sure no single event wipes out your progress.
Correlated pairs aren’t bad - they just need to be used wisely.
If you understand how two pairs move together, you can use that information to confirm your entries. For example, if EUR/USD and GBP/USD both break a key resistance level at the same time, that’s stronger validation than one pair doing it alone.
The trick is in balance - don’t load up on correlated pairs, but don’t ignore them either. They’re valuable signals when used consciously.
Overlapping pairs are sneaky. You might not even realize you’re doubling your risk until it’s too late.
Say you’re long EUR/USD and long GBP/USD. Both go against you because the dollar suddenly strengthens. You just took two losses on one fundamental move.
When correlations are high, those overlaps matter. A good rule of thumb? Limit similar directional exposure to pairs that share the same base or quote currency - especially when correlations exceed 0.7.
Currencies travel in packs. If you’re trading multiple pairs involving the same base currency - like EUR/USD, EUR/GBP, and EUR/JPY - you’re stacking your fate on the euro.
If something hits the eurozone - say a surprise ECB announcement or political shake-up - your entire portfolio could feel the impact.
By checking correlations and diversifying across different base currencies, you give yourself a much smoother ride through those unpredictable market turns.
Sometimes correlations can help you spot timing opportunities.
Let’s say EUR/USD looks ready to break out, but GBP/USD hasn’t confirmed yet. You wait, and when both move in the same direction, that alignment boosts your confidence.
Correlation-based confirmation can keep you from jumping in too early - especially in choppy or indecisive markets. It’s like having a second opinion before committing to a move.
Drawdowns are part of trading life - but correlation helps keep them under control.
If your portfolio is full of positively correlated pairs, one bad move can cause a cascade of losses. But when you blend in uncorrelated trades, those losses can be softened or even balanced by other positions.
That’s why professional traders often say: “Don’t manage trades. Manage correlation.” It’s a quiet way of saying - control the relationships, and you’ll control the chaos.
Professional traders treat correlation matrices like pilots treat flight dashboards - always in view, always checked before takeoff.
They don’t just use them to find trades but to filter them. If a setup looks great but adds too much correlation risk to the book, they skip it. Discipline beats excitement.
This awareness doesn’t come from complexity - it comes from respect. Respect for the interconnected nature of the market.
There’s a calm that comes from understanding correlation. When you know how your trades are related, you stop reacting emotionally to every tick.
You understand that a small loss on one pair might be offset elsewhere. That awareness helps you think strategically, not impulsively. It’s one of those subtle psychological edges that separates professionals from amateurs — knowledge that breeds composure.
You don’t have to calculate everything manually. Many trading platforms offer built-in or plugin-based correlation tools.
Platforms like MetaTrader 4/5 and cTrader have indicators and dashboards that display real-time correlation data. Some even let you customize the timeframes and currency sets to match your trading style.
These tools don’t replace judgment - they enhance it.
Here’s the truth - correlations shift. Not every day, but often enough that ignoring them is risky.
A good rule? Review your correlation matrix at least once a week if you’re an active trader. For swing traders, once or twice a month might be enough.
The key is consistency. Markets evolve, and your correlation awareness should evolve with them.
An outdated correlation matrix can mislead you. Relationships that held true last quarter might have flipped entirely due to central bank actions or macro shifts.
Updating your matrix regularly keeps your risk picture accurate. It’s like checking your mirrors before switching lanes - small habit, big difference.
Rolling correlation simply means tracking how relationships evolve over time. Instead of looking at static values, you observe trends - are two pairs becoming more connected or drifting apart?
This helps traders anticipate changes before they cause surprises. Think of it as watching the tide rather than just measuring the waves.
If you enjoy hands-on analysis, Excel gives you full control. Gather your data, calculate daily percentage changes, and use the CORREL function to find relationships between pairs.
Once built, apply conditional formatting to color-code the results. It’s a little work at first, but the insight you gain is worth every minute.
You’ll never look at your trades the same way again.
When correlation values start shifting, it’s the market whispering something’s changed.
Maybe a central bank altered its tone. Maybe a geopolitical event broke a long-standing relationship. Either way, those shifts carry meaning and traders who notice them early often adapt faster.
Sometimes, pairs that moved together for years suddenly start drifting apart. That’s called a correlation breakdown.
It usually happens when a major economic factor - like interest rate policy - diverges between countries. For example, if the U.K. raises rates while the Eurozone cuts them, the once-synced GBP/USD and EUR/USD might start dancing to different tunes.
Once you begin to truly grasp correlations, you stop seeing each trade in isolation. You start seeing the market as one large, living network - where every move in one currency ripples through another.
When the U.S. dollar strengthens, emerging market currencies may weaken. When gold surges, the Australian dollar often follows. When oil prices fall, the Canadian dollar tends to drop too.
It’s all connected. Correlation helps you see those invisible threads and align your trades with broader market logic.
That awareness doesn’t just improve your strategy - it builds intuition. You stop reacting emotionally and start thinking structurally.
At its core, correlation is a mirror - one that reflects your hidden risks.
It doesn’t tell you what to trade, but it helps you understand how your trades interact.
A trader who studies correlation matrices before opening positions isn’t just being cautious - they’re being strategic. They’re thinking like a portfolio manager, not a gambler.
Because in forex, survival isn’t about winning every trade; it’s about managing exposure, protecting your balance, and positioning yourself for long-term growth.
So, before your next set of trades, take five minutes to check a correlation matrix.
That small habit can be the difference between a week of chaos and a career of consistency.
The forex market is vast and unpredictable - but not unmanageable.
By understanding correlation pairs, monitoring correlation changes, and applying this knowledge through smart diversification, you gain a quiet edge.
You’re no longer chasing trades blindly. You’re crafting a portfolio that breathes, adapts, and endures.
And that’s what risk management is really about - not avoiding risk, but understanding it deeply enough to make it work for you.
So next time you open your trading platform, don’t just ask, “What’s moving today?”
Ask, “How does this move fit into the bigger picture?”
That’s when you stop being a trader who reacts and start being one who plans.
Sam Saleh, a London-based trader, began his trading journey at 19 while studying Business at the University of Bedfordshire. With expertise in trading and a background in marketing, he now coaches at Hola Prime, where he develops educational content aimed at building trader confidence, consistency, and financial literacy.
Still Have Questions?
Feel free to get in touch with us today!
All information provided on this site is for educational purposes only, related to trading in financial markets. It is not intended as financial advice, business or investment recommendation, or as an opportunity or recommendation to trade any investment instruments. Hola Prime only provides an educational environment to traders, including tools, materials and simulated trading platforms which have data feed provided by Liquidity Providers. The information on this site is not directed at residents in any country or jurisdiction where such distribution or use would be contrary to local laws or regulations.
ISO 9001:2015
Quality Management System - QMS
ISO 22301:2019
Business Continuity
Management System - BCMS
ISO/IEC 27001:2022
Information Security
Management System - ISMS
About: Simulated trading operations are managed by Hola Prime Limited, a company registered at L1, Shaw House, 201 Wan Po Road, Tseung Kwan O, Hong Kong.
Holaprime Limited a company registered in Cyprus having registration number HE 454359 is a 100% subsidiary of Holaprime Limited Hong Kong.
For MT4 And MT5: Hola Prime Limited, with Company registration number 220248, and registered office at 4th Floor, Docks 4, The Docks, Caudan, Port Louis, Mauritius, is authorized and regulated by the Financial Services Commission (FSC) of Mauritius as an Investment Dealer (Full Service Dealer, excluding underwriting) under license number GB24203729.
For DXTrade, cTrader and MatchTrader: Gooey Trade, GT Tech LLC 6800 Broken Sound Parkway Northwest Suite 150 Boca Raton, FL 33487 US
RISK DISCLOSURE:
All of the information provided on this website and by Hola Prime Ltd, or its affiliates, is intended solely for Educational purposes. Nothing on this website is to be construed as investment advice, nor an offer or invitation to buy or sell any financial instrument, nor does it endorse, recommend, or sponsor any financial product, company, or fund. Testimonials on the Company’s website may not be reflective of the experience of other clients or customers and should not be considered as an assurance of future performance or success. Hola Prime only provides services of simulated trading and educational tools for skill assessment and enhancement of traders. Hola Prime does not act as a broker and does not accept any deposits. Any purchases made should not be regarded as deposits. There are no promises of rewards or returns. Trading in financial markets is inherently high-risk and speculative. The content and information provided on this website are not intended for distribution to, or use by, any person or entity in any jurisdiction or country where such distribution or use would be contrary to local law or regulation.
HYPOTHETICAL PERFORMANCE DISCLOSURE:
ACFTC Rule 4.4-Hypothetical performance results have many inherent limitations, some of which are described below. No representation is being made that any account will or is likely to achieve profits or losses similar to those shown. In fact, there are frequently sharp differences between hypothetical performance results and the actual results subsequently achieved by any particular trading program. One of the limitations of hypothetical performance results is that they are generally prepared with the benefit of hindsight. In addition, hypothetical trading does not involve financial risk, and no hypothetical trading record can completely account for the impact of financial risk of actual trading. For example, the ability to withstand losses or to adhere to a particular trading program in spite of trading losses is material points, which can also adversely affect actual trading results. There are numerous other factors related to the markets in general or to the implementation of any specific trading program, which cannot be fully accounted for in the preparation of hypothetical performance results and all of which can adversely affect trading results. Testimonials appearing on this website may not be representative of other clients or customers and are not a guarantee of future performance or success.
EVALUATION DISCLOSURE:
The customer pass rate of the Challenge/Evaluation program was 35% between 10th November, 2024 – 29th May, 2025, who traded at least one evaluation and obtained a Hola Prime Account during this time period. The Challenge and Hola Prime Accounts are meant to be a realistic simulation of trading under actual market conditions, including commissions, to mimic real market conditions, as much as possible. The evaluation is difficult to pass even for experienced traders. The Evaluation is not suggested for individuals with little to no trading experience.
CUSTOMER COMPENSATION DISCLOSURE:
All trades presented for compensation to customers should be considered hypothetical and should not be expected to be replicated in a live trading account. Hola Prime Accounts may represent simulated accounts or live or copied accounts. Hola Prime does not provide services to the residents of certain countries including – Afghanistan, Belarus, Burundi, China, Cuba, Congo, Sudan, Sri Lanka, North Korea (Democratic People’s Republic of Korea) and Yemen.
This is the only website for Hola Prime. We are not using any third party websites or links. Any link, outside of this website that claims to be ours, could be fraudulent and users are advised to not use it.
© 2026 Hola Prime All rights reserved.